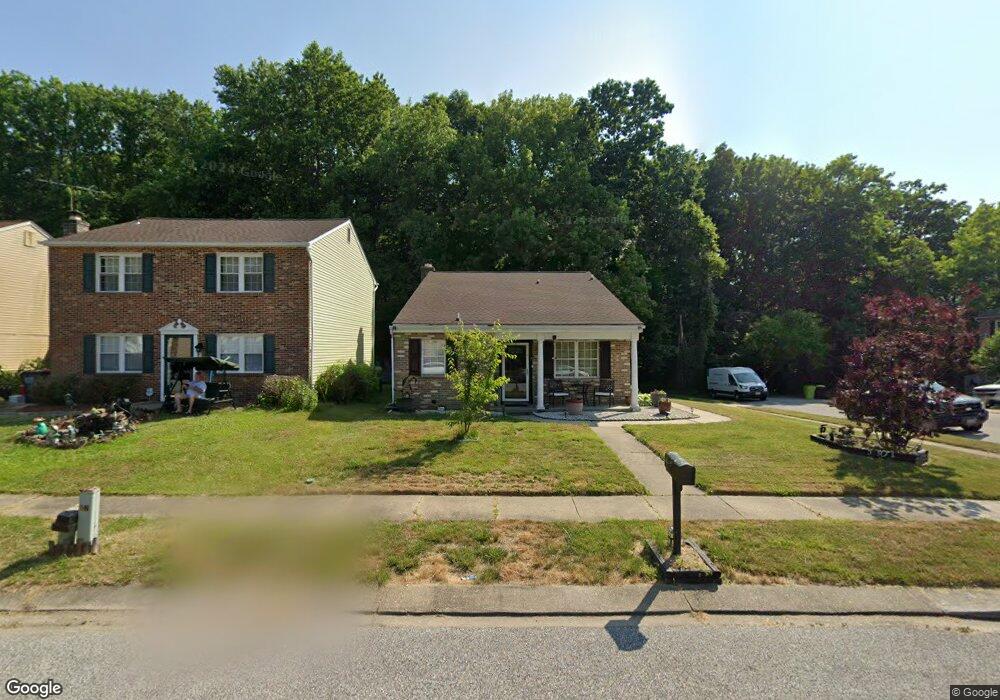
3001 Ebbtide Dr Edgewood, MD 21040
Estimated Value: $303,000 - $341,443
Studio
2
Baths
1,448
Sq Ft
$223/Sq Ft
Est. Value
About This Home
This home is located at 3001 Ebbtide Dr, Edgewood, MD 21040 and is currently estimated at $323,611, approximately $223 per square foot. 3001 Ebbtide Dr is a home located in Harford County with nearby schools including Deerfield Elementary School, Edgewood Middle School, and Edgewood High School.
Ownership History
Date
Name
Owned For
Owner Type
Purchase Details
Closed on
Aug 18, 2005
Sold by
Sheets Charles Allen
Bought by
Shamraj Chaundrapaul
Current Estimated Value
Home Financials for this Owner
Home Financials are based on the most recent Mortgage that was taken out on this home.
Original Mortgage
$18,500
Outstanding Balance
$9,602
Interest Rate
5.67%
Mortgage Type
Stand Alone Second
Estimated Equity
$314,009
Purchase Details
Closed on
Jul 15, 2005
Sold by
Sheets Charles Allen
Bought by
Shamraj Chaundrapaul
Home Financials for this Owner
Home Financials are based on the most recent Mortgage that was taken out on this home.
Original Mortgage
$18,500
Outstanding Balance
$9,602
Interest Rate
5.67%
Mortgage Type
Stand Alone Second
Estimated Equity
$314,009
Purchase Details
Closed on
Dec 17, 1998
Sold by
Bcgs Llc
Bought by
Sheets Charles Allen and Sheets Toy Lee
Create a Home Valuation Report for This Property
The Home Valuation Report is an in-depth analysis detailing your home's value as well as a comparison with similar homes in the area
Home Values in the Area
Average Home Value in this Area
Purchase History
| Date | Buyer | Sale Price | Title Company |
|---|---|---|---|
| Shamraj Chaundrapaul | $185,000 | -- | |
| Shamraj Chaundrapaul | $185,000 | -- | |
| Sheets Charles Allen | $88,500 | -- | |
| Bcgs Llc | $88,200 | -- |
Source: Public Records
Mortgage History
| Date | Status | Borrower | Loan Amount |
|---|---|---|---|
| Open | Shamraj Chaundrapaul | $18,500 | |
| Open | Shamraj Chaundrapaul | $148,000 | |
| Closed | Shamraj Chaundrapaul | $18,500 | |
| Closed | Shamraj Chaundrapaul | $148,000 | |
| Closed | Sheets Charles Allen | -- |
Source: Public Records
Tax History
| Year | Tax Paid | Tax Assessment Tax Assessment Total Assessment is a certain percentage of the fair market value that is determined by local assessors to be the total taxable value of land and additions on the property. | Land | Improvement |
|---|---|---|---|---|
| 2025 | $2,327 | $233,800 | $0 | $0 |
| 2024 | $2,327 | $218,300 | $0 | $0 |
| 2023 | $2,210 | $202,800 | $60,100 | $142,700 |
| 2022 | $2,131 | $195,567 | $0 | $0 |
| 2021 | $2,090 | $188,333 | $0 | $0 |
| 2020 | $2,090 | $181,100 | $60,100 | $121,000 |
| 2019 | $2,055 | $178,100 | $0 | $0 |
| 2018 | $2,002 | $175,100 | $0 | $0 |
| 2017 | $1,968 | $172,100 | $0 | $0 |
| 2016 | -- | $172,100 | $0 | $0 |
| 2015 | $2,297 | $172,100 | $0 | $0 |
| 2014 | $2,297 | $180,600 | $0 | $0 |
Source: Public Records
Map
Nearby Homes
- 606 Harbour Oak Dr
- 2909 Willoughby Beach Rd
- 3151 Ebbtide Dr
- 2935 Ancon Ct
- 2804 Captains Cove Ct
- 408 Bauers Dr
- 303 Lord Willoughby Way
- 2613 Thornberry Dr
- 400 Bauers Dr
- 730 Sequoia Dr
- 308 Laburnum Rd
- 925 Pirates Ct
- 2961 Siwanoy Dr
- 501 Arbor Ct
- 605 Sequoia Dr
- 2425 Sycamore Ln
- 304 Canoe Ln
- 62 Little Creek Ln
- 503 Catalpa Ln
- 1071 Sand Pebble Dr
- 3003 Ebbtide Dr
- 3005 Ebbtide Dr
- 3007 Ebbtide Dr
- 3002 Sounding Dr
- 3000 Sounding Dr
- 3004 Sounding Dr
- 3002 Ebbtide Dr
- 3009 Ebbtide Dr
- 3009 Sounding Dr
- 3008 Sounding Dr
- 3010 Sounding Dr
- 3004 Ebbtide Dr
- 3006 Ebbtide Dr
- 3008 Ebbtide Dr
- 3013 Ebbtide Dr
- 3011 Sounding Dr
- 3012 Sounding Dr
- 3010 Ebbtide Dr
- 3014 Sounding Dr
- 3015 Ebbtide Dr
Your Personal Tour Guide
Ask me questions while you tour the home.