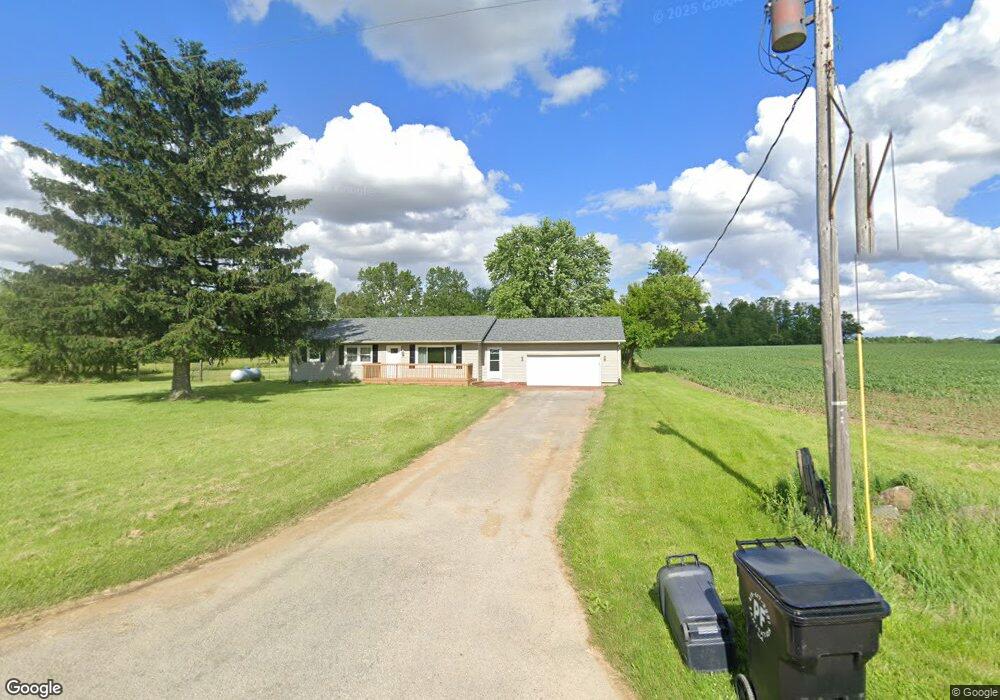
3001 Glenville Rd Bucyrus, OH 44820
Estimated Value: $289,214 - $358,000
3
Beds
1
Bath
1,408
Sq Ft
$233/Sq Ft
Est. Value
About This Home
This home is located at 3001 Glenville Rd, Bucyrus, OH 44820 and is currently estimated at $328,054, approximately $232 per square foot. 3001 Glenville Rd is a home located in Crawford County with nearby schools including Wynford Elementary School and Wynford High School.
Ownership History
Date
Name
Owned For
Owner Type
Purchase Details
Closed on
May 31, 2023
Sold by
Harriger David R
Bought by
Seymour Andrew J and Seymour Felicia D
Current Estimated Value
Home Financials for this Owner
Home Financials are based on the most recent Mortgage that was taken out on this home.
Original Mortgage
$325,395
Outstanding Balance
$312,172
Interest Rate
4%
Mortgage Type
VA
Estimated Equity
$15,882
Purchase Details
Closed on
May 12, 2005
Sold by
Deutsche Bank & Trust Co
Bought by
Harriger David R
Home Financials for this Owner
Home Financials are based on the most recent Mortgage that was taken out on this home.
Original Mortgage
$96,500
Interest Rate
6.13%
Purchase Details
Closed on
May 4, 2005
Sold by
Shawber Ronny J
Bought by
Rittenberry Gertis R and Rittenberry
Home Financials for this Owner
Home Financials are based on the most recent Mortgage that was taken out on this home.
Original Mortgage
$96,500
Interest Rate
6.13%
Create a Home Valuation Report for This Property
The Home Valuation Report is an in-depth analysis detailing your home's value as well as a comparison with similar homes in the area
Home Values in the Area
Average Home Value in this Area
Purchase History
| Date | Buyer | Sale Price | Title Company |
|---|---|---|---|
| Seymour Andrew J | $315,000 | American Title | |
| Seymour Andrew J | $315,000 | American Title | |
| Harriger David R | -- | -- | |
| Rittenberry Gertis R | $9,900 | -- |
Source: Public Records
Mortgage History
| Date | Status | Borrower | Loan Amount |
|---|---|---|---|
| Open | Seymour Andrew J | $325,395 | |
| Closed | Seymour Andrew J | $325,395 | |
| Previous Owner | Harriger David R | $96,500 |
Source: Public Records
Tax History Compared to Growth
Tax History
| Year | Tax Paid | Tax Assessment Tax Assessment Total Assessment is a certain percentage of the fair market value that is determined by local assessors to be the total taxable value of land and additions on the property. | Land | Improvement |
|---|---|---|---|---|
| 2024 | $2,796 | $73,820 | $20,830 | $52,990 |
| 2023 | $2,800 | $31,250 | $10,680 | $20,570 |
| 2022 | $1,427 | $31,250 | $10,680 | $20,570 |
| 2021 | $1,530 | $31,250 | $10,680 | $20,570 |
| 2020 | $1,194 | $26,320 | $10,680 | $15,640 |
| 2019 | $1,229 | $26,320 | $10,680 | $15,640 |
| 2018 | $1,255 | $26,320 | $10,680 | $15,640 |
| 2017 | $1,231 | $26,220 | $10,680 | $15,540 |
| 2016 | $1,030 | $26,220 | $10,680 | $15,540 |
| 2015 | $1,043 | $26,220 | $10,680 | $15,540 |
| 2014 | $1,183 | $27,270 | $10,680 | $16,590 |
| 2013 | $1,183 | $27,270 | $10,680 | $16,590 |
Source: Public Records
Map
Nearby Homes
- 1665 Lincoln Hwy
- 3056 Mccracken Rd
- 2273 Kerstetter Rd
- 275 Brentwood St
- 130 Brentwood St
- 2440 Wyandot Rd
- 1123 Hillcrest Dr
- 1112 Hillcrest Dr
- 1149 Farmview Dr
- 885 W Perry St
- 1145 Lynne Ave
- 308 Lincoln Hwy
- 441 Myers St
- 0 Lynne Ave
- 1315 Lynne Ave
- 609 W Perry St
- 1555 Rosedale Ave
- 1792 Tiffin Rd
- 316 W Warren St
- 452 Pleasant Ln
- 1367 Heinle Rd
- 1340 Heinle Rd
- 1404 Heinle Rd
- 3075 Glenville Rd
- 2922 Glenville Rd
- 3103 Glenville Rd
- 3137 Glenville Rd
- 2852 Glenville Rd
- 3171 Glenville Rd
- 2832 Glenville Rd
- 2832 Glenville Rd
- 1329 Nevada Wynford Rd
- 1314 Bucyrus Nevada Rd
- 1254 Bucyrus Nevada Rd
- 1286 Bucyrus Nevada Rd
- 1212 Bucyrus Nevada Rd
- 1223 Nevada Wynford Rd
- 1302 Nevada Wynford Rd
- 1362 Nevada Wynford Rd
- 1349 Bucyrus Nevada Rd