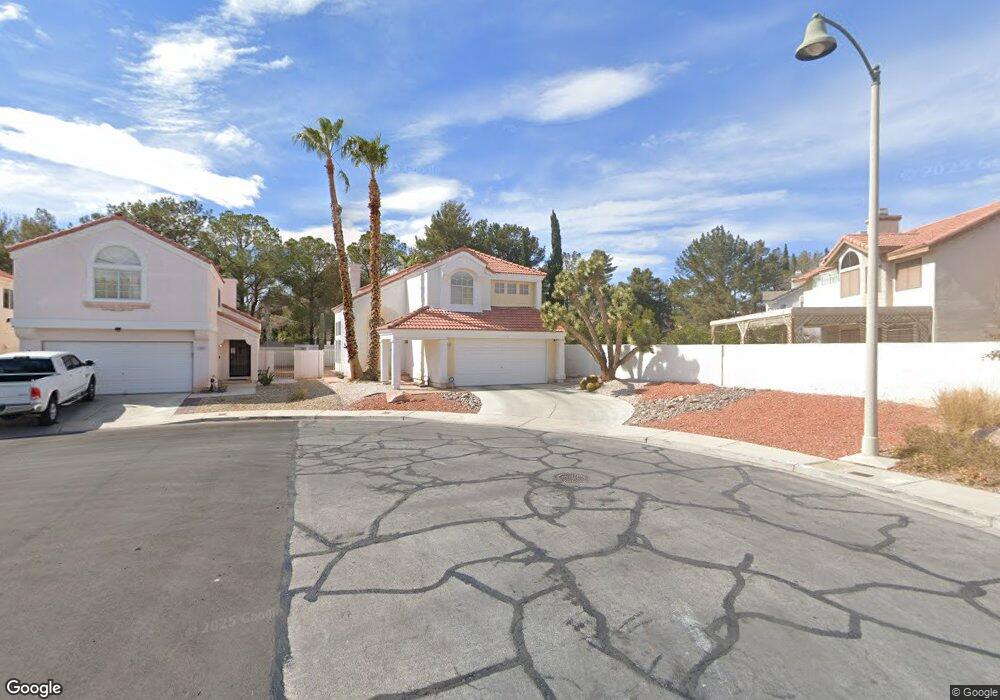
3001 Reef View St Las Vegas, NV 89117
The Section Seven NeighborhoodEstimated Value: $482,000 - $529,000
3
Beds
3
Baths
1,936
Sq Ft
$260/Sq Ft
Est. Value
About This Home
This home is located at 3001 Reef View St, Las Vegas, NV 89117 and is currently estimated at $503,666, approximately $260 per square foot. 3001 Reef View St is a home located in Clark County with nearby schools including M J Christensen Elementary School, Clifford J Lawrence Junior High School, and Bonanza High School.
Ownership History
Date
Name
Owned For
Owner Type
Purchase Details
Closed on
Mar 27, 2012
Sold by
Whittington Kimberly
Bought by
Whittington Kimberly and The Kimberly Whittington Family Trust
Current Estimated Value
Purchase Details
Closed on
Sep 18, 1997
Sold by
Lytle William George and Lytle Annette Burke
Bought by
Whittington Kimberly M
Home Financials for this Owner
Home Financials are based on the most recent Mortgage that was taken out on this home.
Original Mortgage
$139,162
Outstanding Balance
$21,528
Interest Rate
7.45%
Estimated Equity
$482,138
Purchase Details
Closed on
Jan 31, 1995
Sold by
Murrell Michael and Murrell Carrie
Bought by
Lyttle William George and Lyttle Annette Burke
Home Financials for this Owner
Home Financials are based on the most recent Mortgage that was taken out on this home.
Original Mortgage
$129,600
Interest Rate
6.75%
Create a Home Valuation Report for This Property
The Home Valuation Report is an in-depth analysis detailing your home's value as well as a comparison with similar homes in the area
Home Values in the Area
Average Home Value in this Area
Purchase History
| Date | Buyer | Sale Price | Title Company |
|---|---|---|---|
| Whittington Kimberly | -- | None Available | |
| Whittington Kimberly M | $150,000 | First American Title Co | |
| Lyttle William George | $144,000 | First American Title Company |
Source: Public Records
Mortgage History
| Date | Status | Borrower | Loan Amount |
|---|---|---|---|
| Open | Whittington Kimberly M | $139,162 | |
| Previous Owner | Lyttle William George | $129,600 | |
| Closed | Whittington Kimberly M | $7,500 |
Source: Public Records
Tax History Compared to Growth
Tax History
| Year | Tax Paid | Tax Assessment Tax Assessment Total Assessment is a certain percentage of the fair market value that is determined by local assessors to be the total taxable value of land and additions on the property. | Land | Improvement |
|---|---|---|---|---|
| 2025 | $2,109 | $92,358 | $38,500 | $53,858 |
| 2024 | $2,048 | $92,358 | $38,500 | $53,858 |
| 2023 | $2,048 | $85,656 | $33,600 | $52,056 |
| 2022 | $1,988 | $77,410 | $29,400 | $48,010 |
| 2021 | $1,930 | $70,944 | $24,850 | $46,094 |
| 2020 | $1,871 | $70,850 | $24,850 | $46,000 |
| 2019 | $1,817 | $67,917 | $22,400 | $45,517 |
| 2018 | $1,784 | $62,982 | $18,900 | $44,082 |
| 2017 | $2,085 | $63,590 | $18,550 | $45,040 |
| 2016 | $1,671 | $59,761 | $14,350 | $45,411 |
| 2015 | $1,667 | $50,093 | $12,250 | $37,843 |
| 2014 | $1,618 | $47,885 | $8,750 | $39,135 |
Source: Public Records
Map
Nearby Homes
- 3001 Bridge Creek St
- 2909 Ivory Reef Ct
- 2821 Willow Wind Ct
- 9724 Cascade Falls Ave
- 9717 Sierra Mesa Ave
- 9713 Cascade Falls Ave
- 9708 Blazing Star Ct
- 3026 Cherum St
- 10025 Harpoon Cir
- 9624 Beach Water Cir
- 10028 Sail Landing Ct
- 9605 Blowing Sand Cir
- 9833 Dardanelle Ct
- 10191 Refuge Ct Unit 2
- 2729 Beachside Ct
- 10024 Rolling Glen Ct
- 2728 Monrovia Dr
- 9548 Wooden Pier Way
- 2724 Monrovia Dr
- 9820 Cross Creek Way
- 3005 Reef View St
- 9831 Bearpaw Ave
- 3009 Reef View St
- 2937 Morning Dew St
- 3013 Reef View St
- 3000 Reef View St
- 3004 Reef View St Unit n/a
- 3004 Reef View St
- 3017 Reef View St
- 9825 Bearpaw Ave
- 2933 Morning Dew St
- 3021 Reef View St
- 9832 Cactus View Ave
- 3000 Pier Harbor Dr
- 3025 Reef View St
- 9821 Bearpaw Ave
- 2929 Morning Dew St
- 9828 Cactus View Ave
- 2932 Whalers Cove Cir