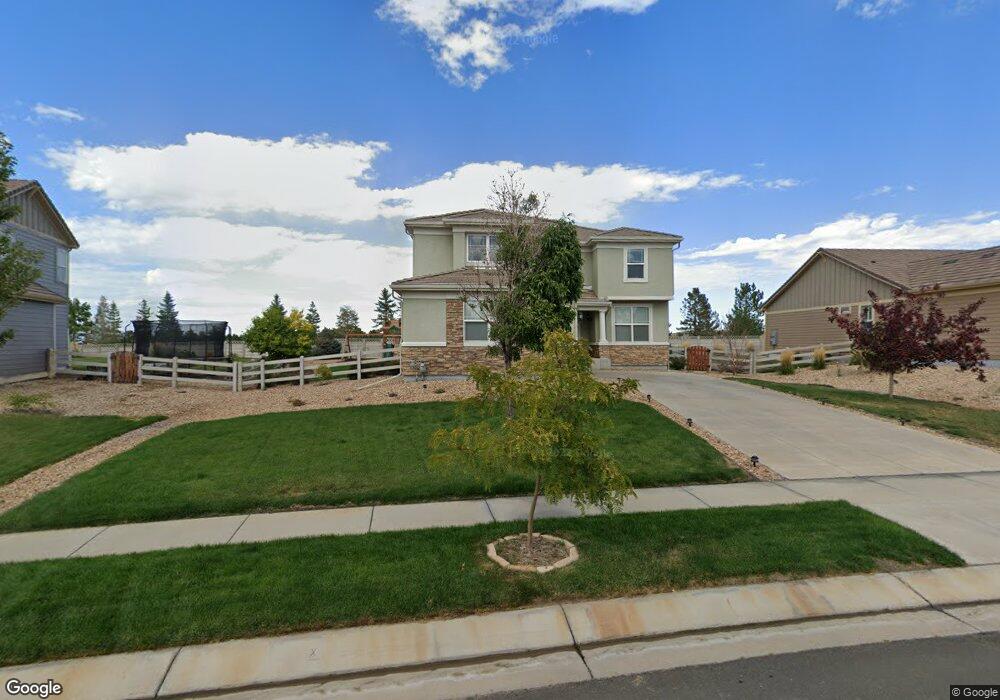
3001 Trinity Loop Broomfield, CO 80023
Anthem NeighborhoodEstimated Value: $771,066 - $852,000
5
Beds
3
Baths
2,275
Sq Ft
$356/Sq Ft
Est. Value
About This Home
This home is located at 3001 Trinity Loop, Broomfield, CO 80023 and is currently estimated at $809,517, approximately $355 per square foot. 3001 Trinity Loop is a home located in Broomfield County with nearby schools including Thunder Vista P-8, Legacy High School, and Prospect Ridge Academy.
Ownership History
Date
Name
Owned For
Owner Type
Purchase Details
Closed on
Sep 21, 2021
Sold by
Bernet Carl P and Bernet Christina L
Bought by
Bernet Carl P and Bernet Christina L
Current Estimated Value
Home Financials for this Owner
Home Financials are based on the most recent Mortgage that was taken out on this home.
Original Mortgage
$262,019
Outstanding Balance
$220,641
Interest Rate
2.8%
Mortgage Type
New Conventional
Estimated Equity
$588,876
Purchase Details
Closed on
Jun 26, 2019
Sold by
Bernet Carl P and Skinner Christina L
Bought by
Bernet Revocable Trust
Purchase Details
Closed on
Dec 7, 2010
Sold by
Pulte Home Corporation
Bought by
Bernet Carl P and Skinner Christina L
Home Financials for this Owner
Home Financials are based on the most recent Mortgage that was taken out on this home.
Original Mortgage
$267,200
Interest Rate
4.22%
Mortgage Type
New Conventional
Create a Home Valuation Report for This Property
The Home Valuation Report is an in-depth analysis detailing your home's value as well as a comparison with similar homes in the area
Home Values in the Area
Average Home Value in this Area
Purchase History
| Date | Buyer | Sale Price | Title Company |
|---|---|---|---|
| Bernet Carl P | -- | Amrock | |
| Bernet Revocable Trust | -- | None Available | |
| Bernet Carl P | $334,000 | None Available |
Source: Public Records
Mortgage History
| Date | Status | Borrower | Loan Amount |
|---|---|---|---|
| Open | Bernet Carl P | $262,019 | |
| Previous Owner | Bernet Carl P | $267,200 |
Source: Public Records
Tax History
| Year | Tax Paid | Tax Assessment Tax Assessment Total Assessment is a certain percentage of the fair market value that is determined by local assessors to be the total taxable value of land and additions on the property. | Land | Improvement |
|---|---|---|---|---|
| 2025 | $6,257 | $50,120 | $11,260 | $38,860 |
| 2024 | $6,257 | $49,680 | $10,480 | $39,200 |
| 2023 | $6,208 | $55,360 | $11,680 | $43,680 |
| 2022 | $5,002 | $36,190 | $7,460 | $28,730 |
| 2021 | $5,160 | $37,220 | $7,670 | $29,550 |
| 2020 | $5,208 | $37,080 | $8,110 | $28,970 |
| 2019 | $5,229 | $37,340 | $8,160 | $29,180 |
| 2018 | $5,064 | $34,350 | $6,430 | $27,920 |
| 2017 | $4,738 | $37,960 | $7,100 | $30,860 |
| 2016 | $4,780 | $32,910 | $7,100 | $25,810 |
Source: Public Records
Map
Nearby Homes
- 3172 Traver Dr
- 3155 Blue Sky Cir Unit 16-303
- 16659 Weston Way
- 16566 Edwards Way
- 3100 Blue Sky Cir Unit 14-303
- 3000 Blue Sky Cir Unit 11-305
- 2764 Ironwood Cir
- 2985 Blue Sky Cir Unit 7-304
- 16555 Jupiter Way
- 3045 Blue Sky Cir Unit 18-102
- 1905 Windemere Ln
- 2875 Blue Sky Cir Unit 4-208
- 2724 Ironwood Place
- 2800 Blue Sky Cir Unit 2-305
- 2800 Blue Sky Cir Unit 2-203
- 2800 Blue Sky Cir Unit 2-208
- 16698 Canby Way
- 2855 Blue Sky Cir Unit 3-204
- 3333 Chapin Place
- 2745 Blue Sky Cir Unit 1-306
- 2977 Trinity Loop
- 3007 Trinity Loop
- 2969 Trinity Loop
- 3000 Trinity Loop
- 3013 Oxford Place
- 3014 Trinity Loop
- 2974 Trinity Loop
- 3019 Oxford Place
- 2951 Trinity Loop
- 2968 Trinity Loop
- 3026 Trinity Loop
- 2923 Trinity Loop
- 2942 Trinity Loop
- 2997 Gemini Loop
- 2975 Gemini Loop
- 3015 Gemini Loop
- 3037 Oxford Place
- 2951 Gemini Loop
- 2918 Trinity Loop
- 3040 Trinity Loop
Your Personal Tour Guide
Ask me questions while you tour the home.