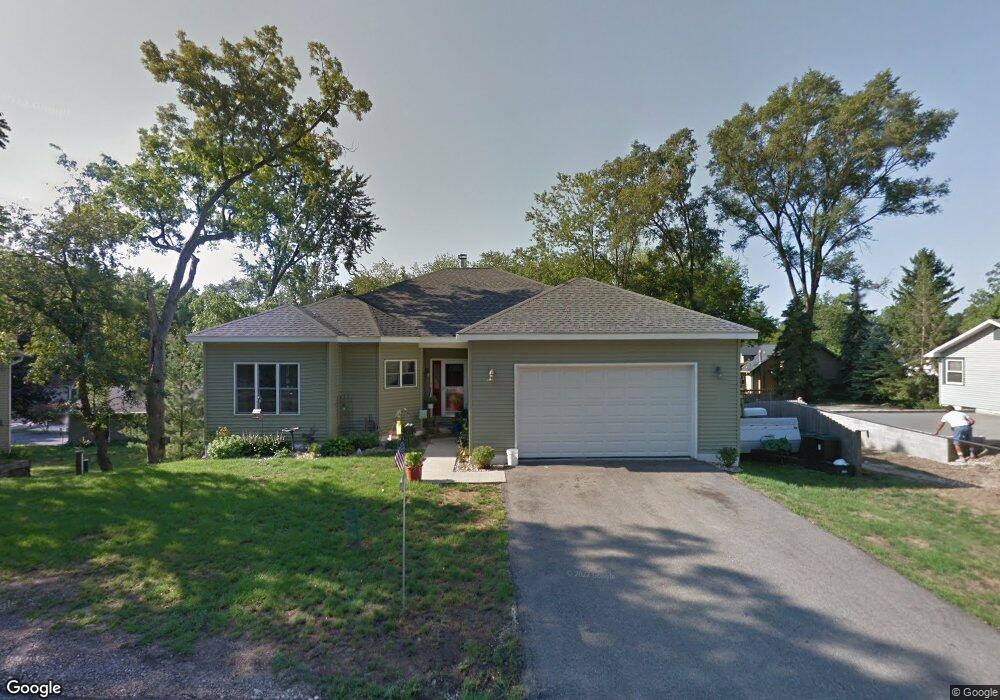
30015 Greenleaf Dr Burlington, WI 53105
Estimated Value: $462,626 - $509,000
--
Bed
--
Bath
--
Sq Ft
10,019
Sq Ft Lot
About This Home
This home is located at 30015 Greenleaf Dr, Burlington, WI 53105 and is currently estimated at $488,907. 30015 Greenleaf Dr is a home located in Racine County with nearby schools including Waller Elementary School, Cooper Montessori School, and Nettie E. Karcher School.
Ownership History
Date
Name
Owned For
Owner Type
Purchase Details
Closed on
May 5, 2017
Sold by
Oldenburg Ted and Oldenburg Robin
Bought by
Wrobel Jeffrey D and Wrobel Lynette A
Current Estimated Value
Purchase Details
Closed on
May 5, 2010
Sold by
Natixis Real Estate Capital Inc
Bought by
Oldenburg Ted and Oldenburg Robin
Home Financials for this Owner
Home Financials are based on the most recent Mortgage that was taken out on this home.
Original Mortgage
$169,220
Interest Rate
5.5%
Mortgage Type
FHA
Purchase Details
Closed on
Feb 3, 2009
Sold by
Flannigon Michael C
Bought by
Naxis Real Estate Capital Inc As Owner
Purchase Details
Closed on
Aug 31, 2006
Sold by
Raboine Brian P
Bought by
Flannigon Michael C and Flannigon Michelle K
Home Financials for this Owner
Home Financials are based on the most recent Mortgage that was taken out on this home.
Original Mortgage
$342,200
Interest Rate
6.7%
Mortgage Type
Future Advance Clause Open End Mortgage
Create a Home Valuation Report for This Property
The Home Valuation Report is an in-depth analysis detailing your home's value as well as a comparison with similar homes in the area
Home Values in the Area
Average Home Value in this Area
Purchase History
| Date | Buyer | Sale Price | Title Company |
|---|---|---|---|
| Wrobel Jeffrey D | $245,000 | Fidelity Title Inc | |
| Oldenburg Ted | $171,500 | Knight Barry Title | |
| Naxis Real Estate Capital Inc As Owner | $186,500 | -- | |
| Flannigon Michael C | $36,500 | -- |
Source: Public Records
Mortgage History
| Date | Status | Borrower | Loan Amount |
|---|---|---|---|
| Previous Owner | Oldenburg Ted | $169,220 | |
| Previous Owner | Flannigon Michael C | $342,200 |
Source: Public Records
Tax History Compared to Growth
Tax History
| Year | Tax Paid | Tax Assessment Tax Assessment Total Assessment is a certain percentage of the fair market value that is determined by local assessors to be the total taxable value of land and additions on the property. | Land | Improvement |
|---|---|---|---|---|
| 2024 | $4,691 | $364,400 | $31,300 | $333,100 |
| 2023 | $4,446 | $364,400 | $31,300 | $333,100 |
| 2022 | $4,355 | $364,400 | $31,300 | $333,100 |
| 2021 | $3,953 | $232,900 | $26,400 | $206,500 |
| 2020 | $3,990 | $232,900 | $26,400 | $206,500 |
| 2019 | $4,017 | $232,900 | $26,400 | $206,500 |
| 2018 | $3,978 | $232,900 | $26,400 | $206,500 |
| 2017 | $4,151 | $232,900 | $26,400 | $206,500 |
| 2016 | $4,456 | $232,900 | $26,400 | $206,500 |
| 2015 | $4,023 | $232,900 | $26,400 | $206,500 |
| 2014 | $4,002 | $232,900 | $26,400 | $206,500 |
| 2013 | $4,323 | $232,900 | $26,400 | $206,500 |
Source: Public Records
Map
Nearby Homes
- 30050 Greenleaf Dr
- 2655 Driftwood Trail
- Lt12 Fischer Dr
- 30248 Forest Dr
- 2705 Knollcrest Dr
- 1508 Mila Way
- 1515 Emma Ln
- Lt39 Jeffrey Dr
- 30422 Jeffrey Dr
- 29222 Durand Ave
- 30701 Jeffrey Dr
- 4314 Marine Dr
- 31014 Weiler Rd
- 3711 Lake St
- 3202 Crossway Rd
- 29120 Ketterhagen Rd
- Pcl3 Lynch Way
- 808 Weiler Rd
- Ashbury Plan at The Glen at Stonegate
- The Carrington II Plan at The Glen at Stonegate
- 2808 Spring Dr Unit 3
- 30021 Greenleaf Dr Unit 3
- 30020 Greenleaf Dr
- Lt178 Greenleaf Dr
- NA Greenleaf Dr
- 30006 Greenleaf Dr
- 30010 Woodlawn Dr
- 30020 Woodlawn Dr
- 2820 Spring Dr
- 30024 Greenleaf Dr
- 29949 Greenleaf Dr
- 30025 Greenleaf Dr
- 30030 Woodlawn Dr
- 2811 Spring Dr
- 30021 Circle Dr
- 30030 Greenleaf Dr
- 2710 Spring Dr
- 30045 Greenleaf Dr
- 29952 Greenleaf Dr
- 29952 Greenleaf Dr Unit 2