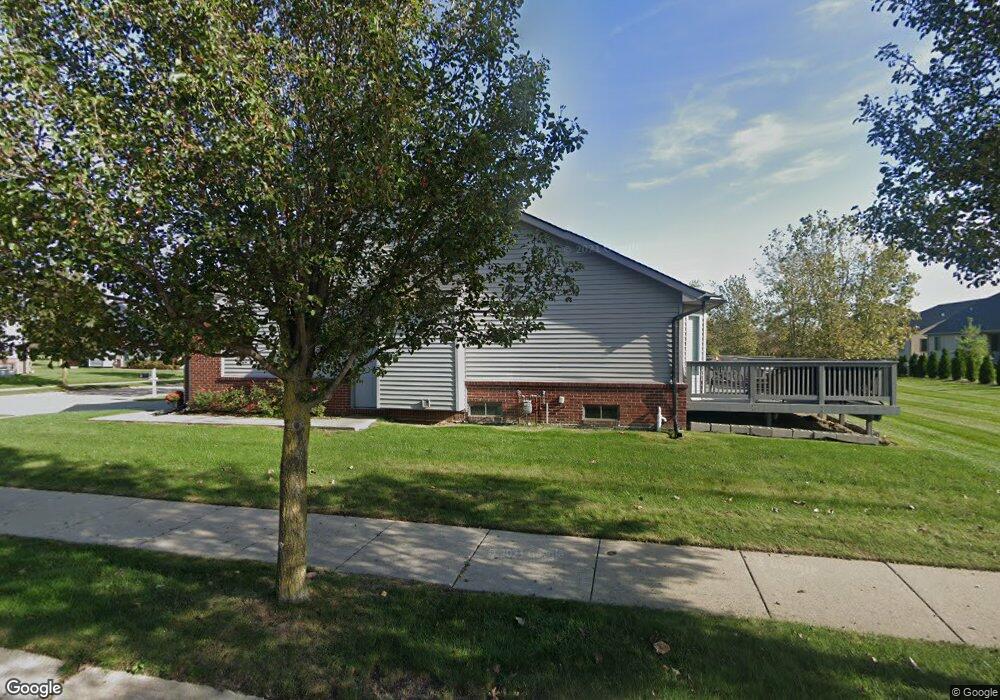
30018 Prospect St Unit 43 Chesterfield, MI 48051
Estimated Value: $267,786 - $313,000
2
Beds
2
Baths
1,364
Sq Ft
$215/Sq Ft
Est. Value
About This Home
This home is located at 30018 Prospect St Unit 43, Chesterfield, MI 48051 and is currently estimated at $292,697, approximately $214 per square foot. 30018 Prospect St Unit 43 is a home located in Macomb County with nearby schools including New Haven High School, Merritt Academy, and Austin Catholic Academy.
Ownership History
Date
Name
Owned For
Owner Type
Purchase Details
Closed on
Feb 13, 2013
Sold by
Feyers Arthur J and Feyers Patricia A
Bought by
Pouttu Jennifer A
Current Estimated Value
Home Financials for this Owner
Home Financials are based on the most recent Mortgage that was taken out on this home.
Original Mortgage
$81,600
Outstanding Balance
$56,858
Interest Rate
3.34%
Mortgage Type
New Conventional
Estimated Equity
$235,839
Purchase Details
Closed on
Sep 24, 2009
Sold by
Wiensch Jean M and Wiensch Fred H
Bought by
Federal Home Loan Mortgage Corp
Purchase Details
Closed on
Jul 10, 2009
Sold by
Wiensch Jean M and Wiensch Fred H
Bought by
Federal Home Loan Mortgage Corp
Purchase Details
Closed on
Nov 22, 2005
Sold by
Village Building Co East Inc
Bought by
Wiensch Jean M and Wiensch Fred W
Purchase Details
Closed on
Jun 9, 2004
Sold by
Dundee Place Llc
Bought by
Village Building Co East Inc
Create a Home Valuation Report for This Property
The Home Valuation Report is an in-depth analysis detailing your home's value as well as a comparison with similar homes in the area
Home Values in the Area
Average Home Value in this Area
Purchase History
| Date | Buyer | Sale Price | Title Company |
|---|---|---|---|
| Pouttu Jennifer A | $105,800 | Title Source Inc | |
| Federal Home Loan Mortgage Corp | $1,500 | None Available | |
| Federal Home Loan Mortgage Corp | $126,826 | None Available | |
| Wiensch Jean M | $186,680 | Lawyers Title Insurance Co | |
| Village Building Co East Inc | $57,343 | Greco |
Source: Public Records
Mortgage History
| Date | Status | Borrower | Loan Amount |
|---|---|---|---|
| Open | Pouttu Jennifer A | $81,600 |
Source: Public Records
Tax History Compared to Growth
Tax History
| Year | Tax Paid | Tax Assessment Tax Assessment Total Assessment is a certain percentage of the fair market value that is determined by local assessors to be the total taxable value of land and additions on the property. | Land | Improvement |
|---|---|---|---|---|
| 2025 | $2,357 | $132,500 | $0 | $0 |
| 2024 | $1,366 | $127,700 | $0 | $0 |
| 2023 | $1,295 | $122,800 | $0 | $0 |
| 2022 | $2,133 | $112,100 | $0 | $0 |
| 2021 | $2,074 | $104,300 | $0 | $0 |
| 2020 | $1,190 | $100,100 | $0 | $0 |
| 2019 | $1,787 | $95,800 | $0 | $0 |
| 2018 | $1,828 | $87,100 | $10,000 | $77,100 |
| 2017 | $1,790 | $81,700 | $10,000 | $71,700 |
| 2016 | $1,787 | $81,700 | $0 | $0 |
| 2015 | $804 | $73,900 | $0 | $0 |
| 2014 | $804 | $52,450 | $6,300 | $46,150 |
| 2012 | -- | $0 | $0 | $0 |
Source: Public Records
Map
Nearby Homes
- 30060 Hickey Rd
- 30030 Hickey Rd
- 53925 Andrew Dr
- 53754 Traditional Dr Unit 66
- 29280 Classic Dr Unit 115
- 29181 Philadelphia Dr Unit 40
- 53724 Newberry Dr Unit 127
- 53091 W Ridge Dr
- 53990 N Foster Rd
- 27350 25 Mile Rd
- 30596 Sabrina Ct
- 53218 Elysia Dr
- 30600 Victoria Ct
- 53534 Spurry Ln
- 30601 Victoria Ct
- 29321 Debbie Dr Unit 43
- 53261 Butternut St
- 30608 Eleanor Ct Unit 72
- 29326 Debbie Dr Unit 54
- 53929 Bates Rd
- 30018 Prospect St
- 54697 Darby St
- 54701 Darby St
- 30030 Prospect St Unit 41
- 30036 Prospect St Unit 40
- 54709 Darby St
- 54714 Darby St Unit 44
- 54718 Darby St Unit 45
- 29985 Quincy St
- 30031 Prospect St Unit 60
- 30037 Prospect St Unit 59
- 54713 Darby St
- 54717 Darby St Unit 4
- 30042 Prospect St Unit 39
- 30048 Prospect St Unit 38
- 30045 Prospect St Unit 58
- 30049 Prospect St Unit 57
- 54722 Darby St Unit 46
- 54722 Darby Unit#46
- 54721 Darby St