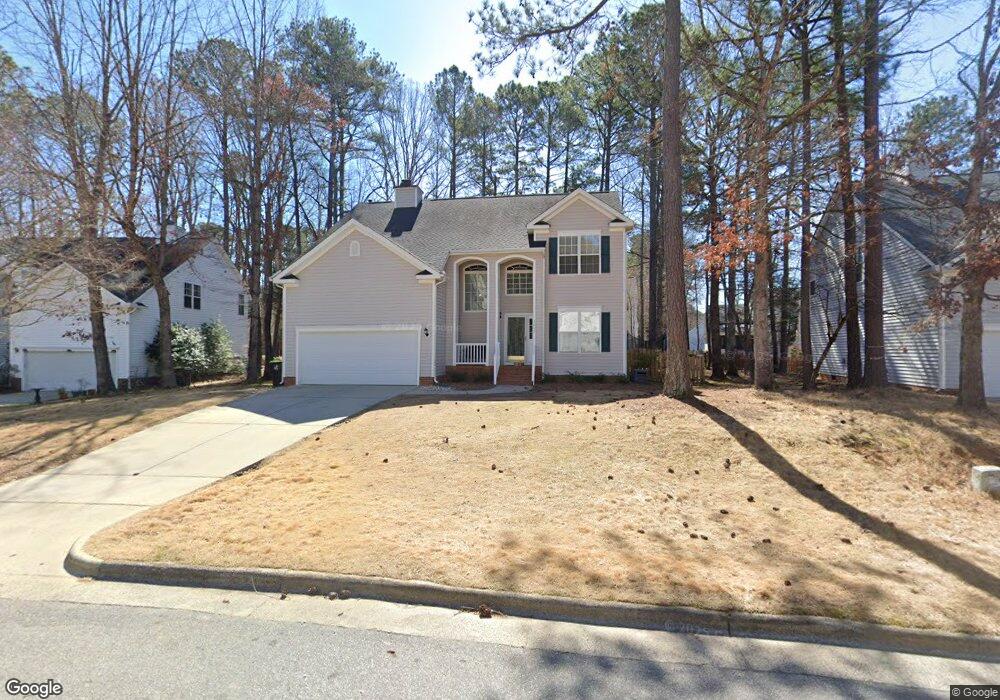
3002 Hambridge Ct Apex, NC 27502
West Apex NeighborhoodEstimated Value: $547,443 - $600,000
3
Beds
3
Baths
2,360
Sq Ft
$242/Sq Ft
Est. Value
About This Home
This home is located at 3002 Hambridge Ct, Apex, NC 27502 and is currently estimated at $570,611, approximately $241 per square foot. 3002 Hambridge Ct is a home located in Wake County with nearby schools including Olive Chapel Elementary School, Lufkin Road Middle School, and Apex Friendship High School.
Ownership History
Date
Name
Owned For
Owner Type
Purchase Details
Closed on
Sep 13, 2015
Sold by
Rossi Shawnda L and Chandler James
Bought by
Newton Jonathan F and Newton Carrie A
Current Estimated Value
Home Financials for this Owner
Home Financials are based on the most recent Mortgage that was taken out on this home.
Original Mortgage
$272,765
Outstanding Balance
$215,040
Interest Rate
4.02%
Mortgage Type
New Conventional
Estimated Equity
$355,571
Purchase Details
Closed on
Nov 26, 2007
Sold by
Porper Daniel S
Bought by
Rossi Shawnda L and Porper Shawnda R
Purchase Details
Closed on
Aug 2, 1999
Sold by
Centex Homes
Bought by
Porper Daniel S and Porper Shawnda R
Home Financials for this Owner
Home Financials are based on the most recent Mortgage that was taken out on this home.
Original Mortgage
$188,320
Interest Rate
7.95%
Create a Home Valuation Report for This Property
The Home Valuation Report is an in-depth analysis detailing your home's value as well as a comparison with similar homes in the area
Home Values in the Area
Average Home Value in this Area
Purchase History
We collect this data history from publicly available records. To have your information removed, we recommend requesting removal directly through your county’s website.
| Date | Buyer | Sale Price | Title Company |
|---|---|---|---|
| Newton Jonathan F | $323,000 | Attorney | |
| Rossi Shawnda L | -- | None Available | |
| Porper Daniel S | $188,500 | -- |
Source: Public Records
Mortgage History
We collect this data history from publicly available records. To have your information removed, we recommend requesting removal directly through your county’s website.
| Date | Status | Borrower | Loan Amount |
|---|---|---|---|
| Open | Newton Jonathan F | $272,765 | |
| Previous Owner | Porper Daniel S | $188,320 |
Source: Public Records
Tax History
| Year | Tax Paid | Tax Assessment Tax Assessment Total Assessment is a certain percentage of the fair market value that is determined by local assessors to be the total taxable value of land and additions on the property. | Land | Improvement |
|---|---|---|---|---|
| 2025 | $4,623 | $527,176 | $180,000 | $347,176 |
| 2024 | $4,519 | $527,176 | $180,000 | $347,176 |
| 2023 | $3,842 | $348,426 | $82,000 | $266,426 |
| 2022 | $3,607 | $348,426 | $82,000 | $266,426 |
| 2021 | $3,469 | $348,426 | $82,000 | $266,426 |
| 2020 | $3,435 | $348,426 | $82,000 | $266,426 |
| 2019 | $3,315 | $290,117 | $82,000 | $208,117 |
| 2018 | $3,123 | $290,117 | $82,000 | $208,117 |
| 2017 | $2,907 | $290,117 | $82,000 | $208,117 |
| 2016 | $2,865 | $290,117 | $82,000 | $208,117 |
| 2015 | -- | $279,765 | $72,000 | $207,765 |
| 2014 | $2,728 | $279,765 | $72,000 | $207,765 |
Source: Public Records
Map
Nearby Homes
- 2997 Rise and Shine Rd
- 3138 Cathedral Comb Dr Unit 252
- 3106 Cathedral Comb Dr
- 3104 Cathedral Comb Dr
- 3110 Honeydew Dr Unit Lot 198
- 3120 Cathedral Comb Dr Unit 247
- 3118 Cathedral Comb Dr
- 3102 Cathedral Comb Dr Unit 239
- 3116 Dadant Dr Unit Lot 186
- 3116 Cathedral Comb Dr Unit 245
- 3102 Cathedral Comb Dr
- 3110 Honeydew Dr
- 3005 Yorkmont Ct
- 1265 Meadow Queen Ln
- 503 Homestead Park Dr
- 2720 Spotted Coral Ct
- 3910 Glorybower Way
- 919 Homestead Park Dr
- 3002 Jehon Ct
- 1112 Goliath Ln
- 4036 Winecott Dr
- 4038 Winecott Dr
- 4034 Winecott Dr
- 4040 Winecott Dr
- 4032 Winecott Dr
- 4031 Winecott Dr
- 3001 Steele Creek Ct
- 3106 Shopton Dr
- 3104 Shopton Dr
- 3108 Shopton Dr
- 4030 Winecott Dr
- 4039 Winecott Dr
- 3110 Shopton Dr
- 4042 Winecott Dr
- 3003 Steele Creek Ct
- 3102 Shopton Dr
- 4027 Winecott Dr
- 3200 Shopton Dr
- 4028 Winecott Dr
- 4046 Winecott Dr
Your Personal Tour Guide
Ask me questions while you tour the home.