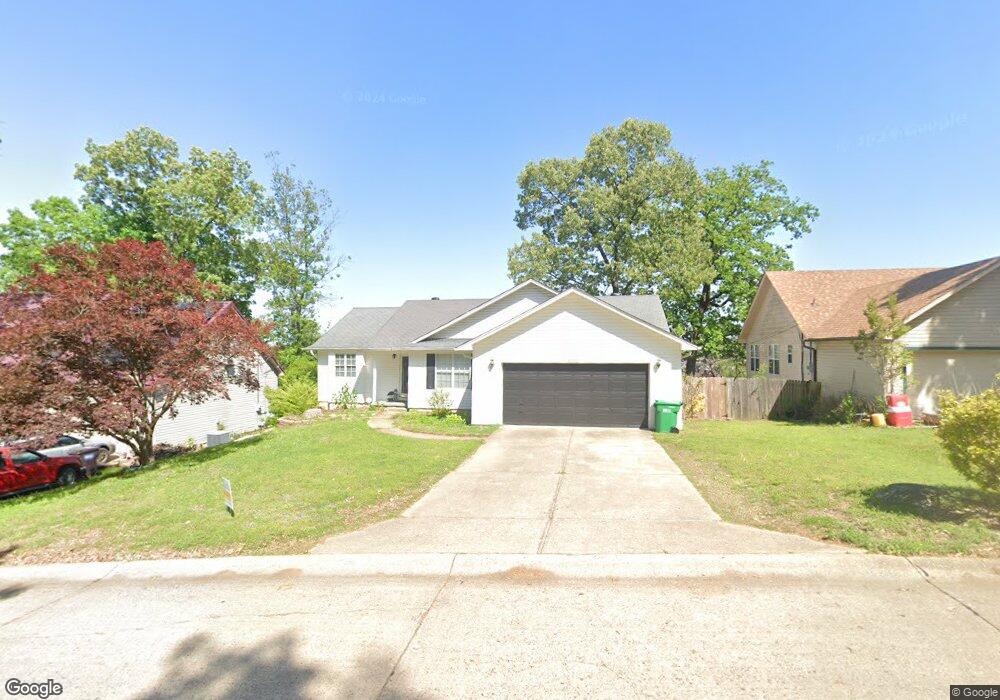
3002 Oakbrook Benton, AR 72015
Estimated Value: $203,000 - $211,882
3
Beds
2
Baths
1,408
Sq Ft
$147/Sq Ft
Est. Value
About This Home
This home is located at 3002 Oakbrook, Benton, AR 72015 and is currently estimated at $206,971, approximately $146 per square foot. 3002 Oakbrook is a home located in Saline County with nearby schools including Perrin Elementary School, Benton Middle School, and Benton Junior High School.
Ownership History
Date
Name
Owned For
Owner Type
Purchase Details
Closed on
Oct 5, 2020
Sold by
Smith Tad Holden
Bought by
Hope James
Current Estimated Value
Home Financials for this Owner
Home Financials are based on the most recent Mortgage that was taken out on this home.
Original Mortgage
$147,312
Outstanding Balance
$130,432
Interest Rate
2.9%
Mortgage Type
VA
Estimated Equity
$76,539
Purchase Details
Closed on
Aug 15, 2008
Sold by
Goshien Ann Roselyn and Goshien Brad
Bought by
Smith Tad Holden
Home Financials for this Owner
Home Financials are based on the most recent Mortgage that was taken out on this home.
Original Mortgage
$124,729
Interest Rate
6.42%
Mortgage Type
FHA
Purchase Details
Closed on
Sep 3, 2002
Bought by
Goshien
Purchase Details
Closed on
Feb 26, 1997
Bought by
Salvation Army
Purchase Details
Closed on
May 1, 1992
Bought by
Tedford
Purchase Details
Closed on
Nov 1, 1991
Bought by
Dhb
Create a Home Valuation Report for This Property
The Home Valuation Report is an in-depth analysis detailing your home's value as well as a comparison with similar homes in the area
Home Values in the Area
Average Home Value in this Area
Purchase History
| Date | Buyer | Sale Price | Title Company |
|---|---|---|---|
| Hope James | $144,000 | Lenders Title Company | |
| Hope James | $144,000 | Lenders Title Company | |
| Smith Tad Holden | $933,636 | None Available | |
| Goshien | $84,000 | -- | |
| Salvation Army | $90,000 | -- | |
| Tedford | $84,000 | -- | |
| Dhb | -- | -- |
Source: Public Records
Mortgage History
| Date | Status | Borrower | Loan Amount |
|---|---|---|---|
| Open | Hope James | $147,312 | |
| Closed | Hope James | $147,312 | |
| Previous Owner | Smith Tad Holden | $124,729 |
Source: Public Records
Tax History
| Year | Tax Paid | Tax Assessment Tax Assessment Total Assessment is a certain percentage of the fair market value that is determined by local assessors to be the total taxable value of land and additions on the property. | Land | Improvement |
|---|---|---|---|---|
| 2025 | $1,730 | $31,236 | $6,200 | $25,036 |
| 2024 | $1,771 | $31,236 | $6,200 | $25,036 |
| 2023 | $1,656 | $31,236 | $6,200 | $25,036 |
| 2022 | $1,518 | $31,236 | $6,200 | $25,036 |
| 2021 | $1,380 | $24,910 | $5,200 | $19,710 |
| 2020 | $1,005 | $24,910 | $5,200 | $19,710 |
| 2019 | $1,005 | $24,910 | $5,200 | $19,710 |
| 2018 | $1,028 | $24,910 | $5,200 | $19,710 |
| 2017 | $981 | $24,910 | $5,200 | $19,710 |
| 2016 | $1,299 | $22,910 | $4,400 | $18,510 |
| 2015 | $926 | $22,910 | $4,400 | $18,510 |
| 2014 | $935 | $22,910 | $4,400 | $18,510 |
Source: Public Records
Map
Nearby Homes
- 3103 Hamilton Cove
- 2905 Janet
- 3158 Stonewall Dr
- 2409 Oakbrook Dr
- 3027 Sue St
- 3475 Bay Meadow Dr
- 3702 Buckskin Rd
- 2521 Northshore Dr
- 3002 Sue St
- 3018 Dapple Gray Rd
- 2900 Perth Cove
- 4004 Evergreen Dr
- 3215 Shelby Dr
- 1020 Raven Walk Dr
- 1092 Raven Walk Dr
- 1016 Raven Walk Dr
- 1032 Raven Walk Dr
- 1012 Raven Walk Dr
- 1044 Raven Walk Dr
- 1056 Raven Walk Dr
Your Personal Tour Guide
Ask me questions while you tour the home.