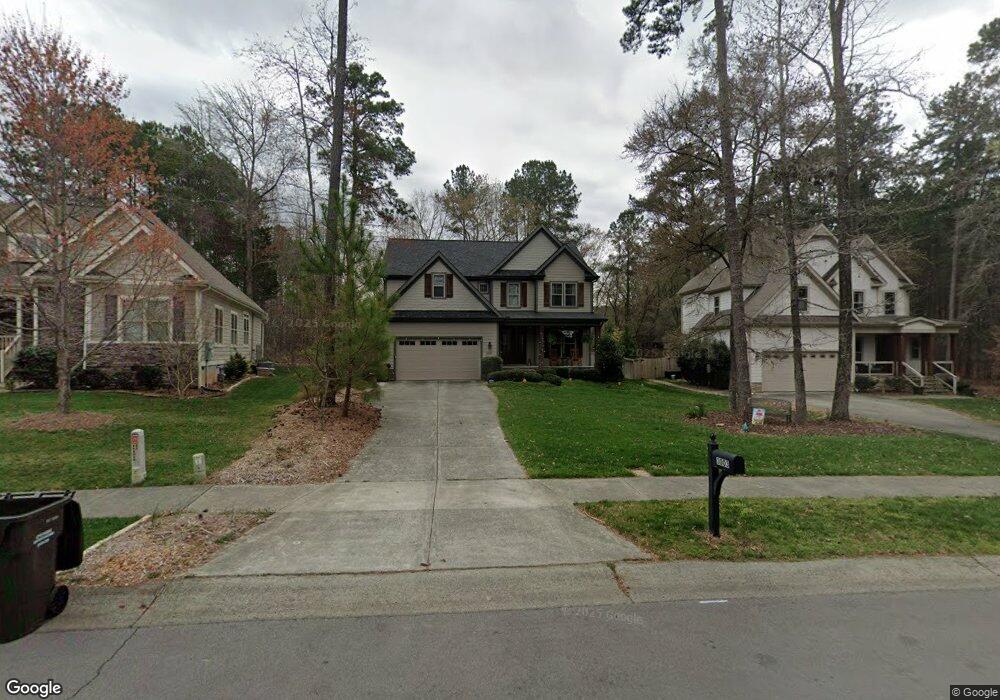
3003 Glenn Glade Dr Unit 2 Durham, NC 27712
North Durham NeighborhoodEstimated Value: $636,908 - $694,000
5
Beds
3
Baths
2,696
Sq Ft
$247/Sq Ft
Est. Value
About This Home
This home is located at 3003 Glenn Glade Dr Unit 2, Durham, NC 27712 and is currently estimated at $665,477, approximately $246 per square foot. 3003 Glenn Glade Dr Unit 2 is a home located in Durham County with nearby schools including Hillandale Elementary School, George L Carrington Middle, and Riverside High School.
Ownership History
Date
Name
Owned For
Owner Type
Purchase Details
Closed on
Feb 13, 2017
Sold by
Tuledo Builders Llc
Bought by
Gordon Max Joseph
Current Estimated Value
Home Financials for this Owner
Home Financials are based on the most recent Mortgage that was taken out on this home.
Original Mortgage
$120,000
Outstanding Balance
$99,272
Interest Rate
4.17%
Mortgage Type
New Conventional
Estimated Equity
$566,205
Purchase Details
Closed on
Dec 18, 2013
Sold by
Espitia Esequiel and Mosqueda Juana Garcia
Bought by
Toledo Builders Llc
Purchase Details
Closed on
Sep 3, 2013
Sold by
Nicholas Peter and Nicholas Kelly
Bought by
Espitia Esequiel
Purchase Details
Closed on
Dec 28, 2011
Sold by
Branch Banking & Trust Company
Bought by
Nicholas Peter and Nicholas Kelly
Purchase Details
Closed on
Aug 15, 2008
Sold by
Trinity Builders Llc
Bought by
Branch Banking & Trust Co
Create a Home Valuation Report for This Property
The Home Valuation Report is an in-depth analysis detailing your home's value as well as a comparison with similar homes in the area
Home Values in the Area
Average Home Value in this Area
Purchase History
| Date | Buyer | Sale Price | Title Company |
|---|---|---|---|
| Gordon Max Joseph | $395,000 | -- | |
| Toledo Builders Llc | -- | None Available | |
| Espitia Esequiel | $25,000 | None Available | |
| Nicholas Peter | $32,000 | None Available | |
| Branch Banking & Trust Co | $54,270 | None Available |
Source: Public Records
Mortgage History
| Date | Status | Borrower | Loan Amount |
|---|---|---|---|
| Open | Gordon Max Joseph | $120,000 |
Source: Public Records
Tax History
| Year | Tax Paid | Tax Assessment Tax Assessment Total Assessment is a certain percentage of the fair market value that is determined by local assessors to be the total taxable value of land and additions on the property. | Land | Improvement |
|---|---|---|---|---|
| 2025 | $6,554 | $661,162 | $123,300 | $537,862 |
| 2024 | $5,038 | $361,174 | $68,600 | $292,574 |
| 2023 | $4,731 | $361,174 | $68,600 | $292,574 |
| 2022 | $4,623 | $361,174 | $68,600 | $292,574 |
| 2021 | $4,601 | $361,174 | $68,600 | $292,574 |
| 2020 | $4,493 | $361,174 | $68,600 | $292,574 |
| 2019 | $4,493 | $361,174 | $68,600 | $292,574 |
| 2018 | $4,626 | $341,016 | $54,880 | $286,136 |
| 2017 | $1,828 | $135,757 | $54,880 | $80,877 |
| 2016 | $714 | $54,880 | $54,880 | $0 |
| 2015 | $1,113 | $80,400 | $80,400 | $0 |
| 2014 | -- | $80,400 | $80,400 | $0 |
Source: Public Records
Map
Nearby Homes
- 3026 Rosebriar Dr
- 1016 Skyler Ln
- 1113 Umstead Grove Way
- 1 Signet Dr Unit A17
- 3775 Guess Rd Unit 43
- 405 Latta Rd
- 1918 Peppertree St
- 411 Latta Cir
- 9 Otters Run
- 1011 Umstead Rd
- 1013 Umstead Rd
- 1427 Cherrycrest Dr
- 1425 Cherrycrest Dr
- 1421 Cherrycrest Dr
- 5005 Gatewood Dr
- 1419 Cherrycrest Dr
- 337 Latta Rd
- 3023 Pump Station Ln
- 34 Justin Ct
- 913 Woodside Park Ln
- 3003 Glenn Glade Dr
- 3001 Glenn Glade Dr Unit 1
- 3001 Glenn Glade Dr
- 3005 Glenn Glade Dr
- 3005 Glenn Glade Dr Unit 7011 Fayetteville Ro
- 3305 Golden Heather Dr
- 3402 Golden Heather Dr
- 3402 Golden Heather Dr Unit 16
- 3304 Golden Heather Dr
- 3002 Glenn Glade Dr
- 3306 Golden Heather Dr
- 3004 Glenn Glade Dr
- 3004 Glenn Glade Dr Unit 4
- 3130 Rose of Sharon Rd
- 4 Piney Ridge Ct
- 4 Piney Ridge Ct Unit 20
- 3126 Rose of Sharon Rd
- 2921 Reynolda Cir
- 3405 Golden Heather Dr
- 3124 Rose of Sharon Rd
Your Personal Tour Guide
Ask me questions while you tour the home.