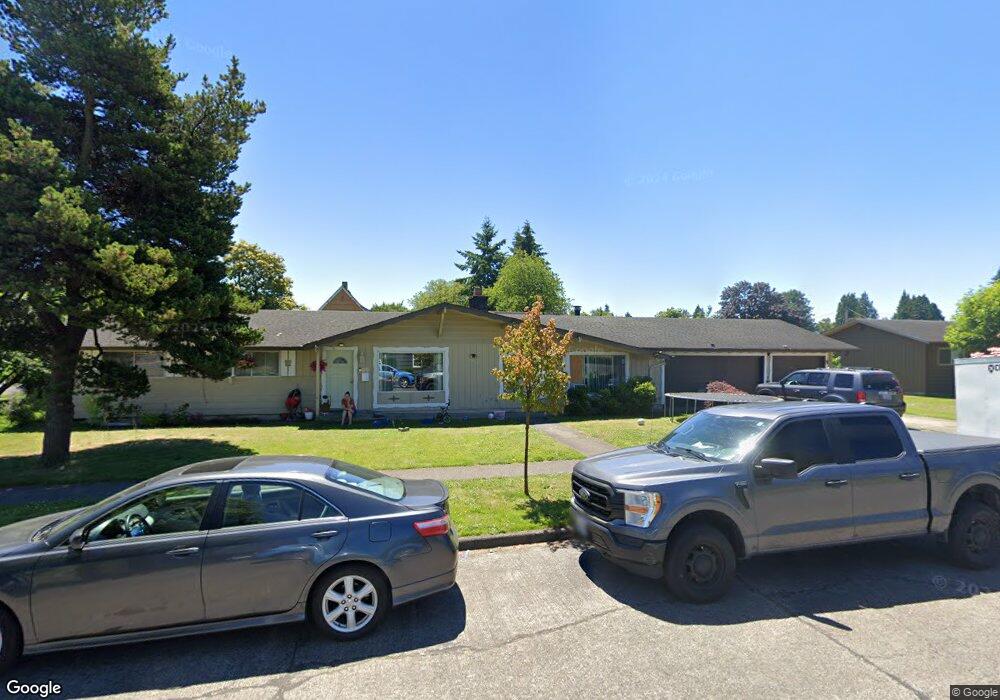
3003 Hudson St Longview, WA 98632
Olympic West NeighborhoodEstimated Value: $371,000 - $388,000
3
Beds
2
Baths
1,560
Sq Ft
$243/Sq Ft
Est. Value
About This Home
This home is located at 3003 Hudson St, Longview, WA 98632 and is currently estimated at $379,555, approximately $243 per square foot. 3003 Hudson St is a home located in Cowlitz County with nearby schools including Olympic Elementary School, Monticello Middle School, and R.A. Long High School.
Ownership History
Date
Name
Owned For
Owner Type
Purchase Details
Closed on
Aug 16, 2024
Sold by
Cheung Ricky Y N
Bought by
Cheung Hing Wa
Current Estimated Value
Purchase Details
Closed on
Jun 12, 2014
Sold by
Tonissen Jeremy G
Bought by
Cheung Ricky and Cheung Hing Wa
Home Financials for this Owner
Home Financials are based on the most recent Mortgage that was taken out on this home.
Original Mortgage
$123,200
Interest Rate
3.35%
Mortgage Type
New Conventional
Purchase Details
Closed on
Sep 11, 2013
Sold by
Tonissen Jeremy G and Odutola Denise
Bought by
Tonissen Jeremy G
Create a Home Valuation Report for This Property
The Home Valuation Report is an in-depth analysis detailing your home's value as well as a comparison with similar homes in the area
Home Values in the Area
Average Home Value in this Area
Purchase History
| Date | Buyer | Sale Price | Title Company |
|---|---|---|---|
| Cheung Hing Wa | -- | None Listed On Document | |
| Cheung Ricky | $154,000 | Stewart Title | |
| Tonissen Jeremy G | -- | None Available |
Source: Public Records
Mortgage History
| Date | Status | Borrower | Loan Amount |
|---|---|---|---|
| Previous Owner | Cheung Ricky | $123,200 |
Source: Public Records
Tax History
| Year | Tax Paid | Tax Assessment Tax Assessment Total Assessment is a certain percentage of the fair market value that is determined by local assessors to be the total taxable value of land and additions on the property. | Land | Improvement |
|---|---|---|---|---|
| 2024 | $2,745 | $316,590 | $43,890 | $272,700 |
| 2023 | $3,096 | $358,330 | $39,900 | $318,430 |
| 2022 | $2,811 | $343,170 | $39,900 | $303,270 |
| 2021 | $2,968 | $282,510 | $39,900 | $242,610 |
| 2020 | $2,219 | $268,780 | $39,900 | $228,880 |
| 2019 | $2,089 | $210,707 | $39,900 | $170,807 |
| 2018 | $2,262 | $193,780 | $39,900 | $153,880 |
| 2017 | $2,002 | $172,380 | $39,900 | $132,480 |
| 2016 | $1,836 | $155,240 | $38,000 | $117,240 |
| 2015 | $1,847 | $145,560 | $38,000 | $107,560 |
| 2013 | -- | $130,290 | $38,000 | $92,290 |
Source: Public Records
Map
Nearby Homes
- 1409 31st Ave
- 1315 Midland Ave
- 3102 Garfield St
- 2902 Garfield St
- 2829 Hemlock St
- 2737 Louisiana St
- 1044 33rd Ave
- 3118 Dover St
- 2714 Louisiana St
- 2949 Dover St
- 2609 Hemlock St
- 2005 Tibbetts Dr Unit 203
- 2005 Tibbetts Dr Unit 209
- 2005 Tibbetts Dr Unit 305
- 2005 Tibbetts Dr Unit 106
- 2005 Tibbetts Dr Unit 313
- 2005 Tibbetts Dr Unit 213
- 2787 Maryland St
- 359 Douglas St
- 2830 Colorado St
Your Personal Tour Guide
Ask me questions while you tour the home.