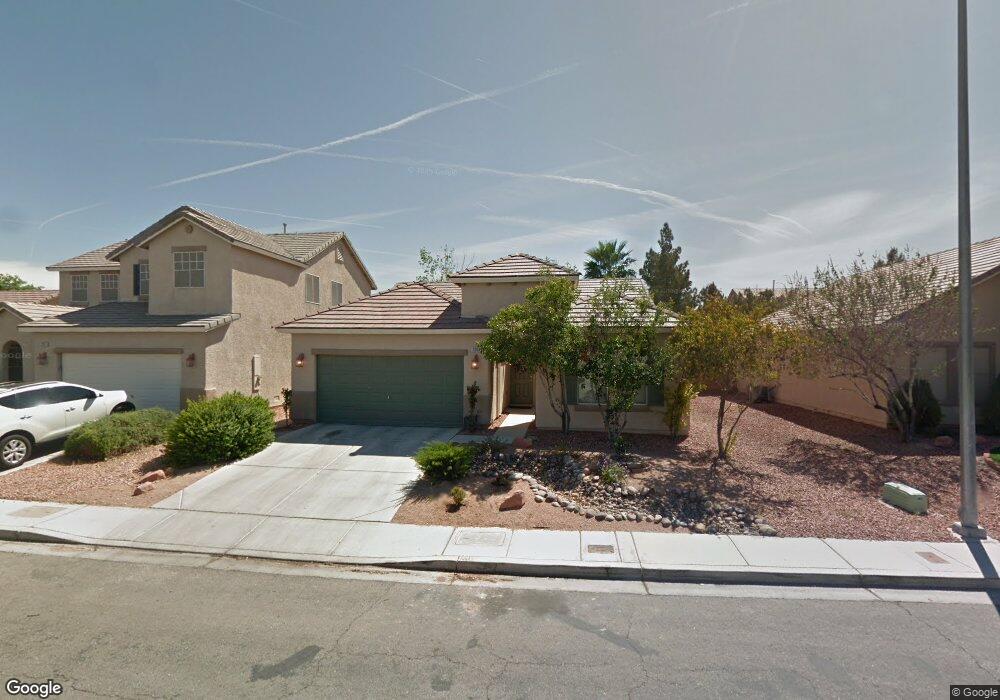
3003 Macaroon Way North Las Vegas, NV 89031
Craig Ranch NeighborhoodEstimated Value: $372,322 - $416,000
3
Beds
2
Baths
1,503
Sq Ft
$263/Sq Ft
Est. Value
About This Home
This home is located at 3003 Macaroon Way, North Las Vegas, NV 89031 and is currently estimated at $394,581, approximately $262 per square foot. 3003 Macaroon Way is a home located in Clark County with nearby schools including Eva G. Simmons Elementary School, Brian & Teri Cram Middle School, and Legacy High School.
Ownership History
Date
Name
Owned For
Owner Type
Purchase Details
Closed on
Apr 28, 2021
Sold by
Jones Bryce A
Bought by
Lopez Rodriguez David
Current Estimated Value
Home Financials for this Owner
Home Financials are based on the most recent Mortgage that was taken out on this home.
Original Mortgage
$255,290
Outstanding Balance
$230,995
Interest Rate
3%
Mortgage Type
FHA
Estimated Equity
$163,586
Purchase Details
Closed on
Feb 28, 2006
Sold by
Fabiano Todd and Fabiano Renee
Bought by
Jones Bryce A
Home Financials for this Owner
Home Financials are based on the most recent Mortgage that was taken out on this home.
Original Mortgage
$273,540
Interest Rate
6.04%
Mortgage Type
Fannie Mae Freddie Mac
Purchase Details
Closed on
Jul 10, 2000
Sold by
Richmond American Homes Of Nevada Inc
Bought by
Fabiano Todd and Fabiano Renee
Home Financials for this Owner
Home Financials are based on the most recent Mortgage that was taken out on this home.
Original Mortgage
$124,650
Interest Rate
8.55%
Create a Home Valuation Report for This Property
The Home Valuation Report is an in-depth analysis detailing your home's value as well as a comparison with similar homes in the area
Home Values in the Area
Average Home Value in this Area
Purchase History
| Date | Buyer | Sale Price | Title Company |
|---|---|---|---|
| Lopez Rodriguez David | $260,000 | Wfg National Title Compan | |
| Jones Bryce A | $282,000 | Ticor Title Of Nevada Inc | |
| Fabiano Todd | $131,231 | Old Republic Title Company |
Source: Public Records
Mortgage History
| Date | Status | Borrower | Loan Amount |
|---|---|---|---|
| Open | Lopez Rodriguez David | $255,290 | |
| Previous Owner | Jones Bryce A | $273,540 | |
| Previous Owner | Fabiano Todd | $124,650 |
Source: Public Records
Tax History Compared to Growth
Tax History
| Year | Tax Paid | Tax Assessment Tax Assessment Total Assessment is a certain percentage of the fair market value that is determined by local assessors to be the total taxable value of land and additions on the property. | Land | Improvement |
|---|---|---|---|---|
| 2025 | $1,862 | $96,878 | $32,900 | $63,978 |
| 2024 | $1,663 | $96,878 | $32,900 | $63,978 |
| 2023 | $1,107 | $90,749 | $32,200 | $58,549 |
| 2022 | $1,540 | $80,179 | $26,600 | $53,579 |
| 2021 | $1,426 | $72,291 | $21,350 | $50,941 |
| 2020 | $1,321 | $72,609 | $22,050 | $50,559 |
| 2019 | $1,238 | $68,819 | $18,900 | $49,919 |
| 2018 | $1,182 | $63,398 | $15,400 | $47,998 |
| 2017 | $2,066 | $61,579 | $12,950 | $48,629 |
| 2016 | $1,107 | $52,065 | $8,750 | $43,315 |
| 2015 | $1,104 | $38,713 | $7,000 | $31,713 |
| 2014 | $1,070 | $32,349 | $7,700 | $24,649 |
Source: Public Records
Map
Nearby Homes
- 5930 Abyss Ct
- 3106 Saleen Ct
- 2707 Gardenia Flower Ave
- 3114 Mastercraft Ave
- 3021 New Journey Way
- 2610 Gardenia Flower Ave
- 3405 Red Fire Ave
- 6140 Passionate Ct
- 3107 Sunrise Cove Ave
- 2426 Inlet Beach Ct
- 3304 W El Campo Grande Ave
- 6032 Glitter Gold Ct
- 2716 Orchid Moon Ct
- 3214 Inlet Bay Ave
- 3123 Inlet Bay Ave
- 3509 Red Fire Ave
- 3217 Palladio Ave
- 3513 Mastercraft Ave
- 2414 Lahaina Ct
- 3604 Sandy Brown Ave
- 2927 Macaroon Way
- 3007 Macaroon Way
- 3006 Anchorman Way
- 3002 Anchorman Way
- 2923 Macaroon Way
- 3011 Macaroon Way
- 3010 Anchorman Way
- 2924 Anchorman Way
- 5924 Beeline Ct
- 5923 Beeline Ct
- 2919 Macaroon Way
- 3015 Macaroon Way
- 3014 Anchorman Way
- 2920 Anchorman Way
- 5928 Beeline Ct
- 5925 Abyss Ct
- 5927 Beeline Ct
- 2915 Macaroon Way
- 3019 Macaroon Way
- 3018 Anchorman Way Unit 1