Estimated Value: $630,000 - $701,000
3
Beds
3
Baths
2,539
Sq Ft
$258/Sq Ft
Est. Value
About This Home
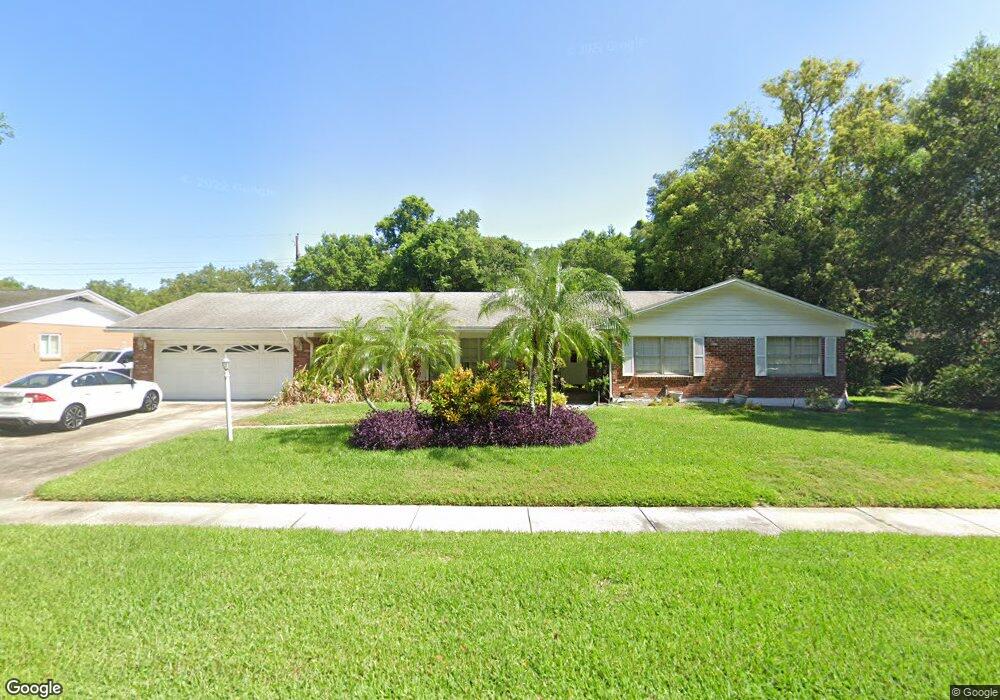
This home is located at 3003 Peacock Ln, Tampa, FL 33618 and is currently estimated at $654,855, approximately $257 per square foot. 3003 Peacock Ln is a home located in Hillsborough County with nearby schools including Carrollwood Elementary School, Chamberlain High School, and Legacy Preparatory Academy.
Ownership History
Date
Name
Owned For
Owner Type
Purchase Details
Closed on
Jun 13, 2000
Sold by
Fernandez Sylvia
Bought by
Martinez Jesus A and Snyder Patricia E
Current Estimated Value
Home Financials for this Owner
Home Financials are based on the most recent Mortgage that was taken out on this home.
Original Mortgage
$99,700
Outstanding Balance
$34,872
Interest Rate
8.11%
Mortgage Type
New Conventional
Estimated Equity
$619,983
Purchase Details
Closed on
Jun 22, 1998
Sold by
O'Keefe Kathryn I and O'Keefe R
Bought by
Fernandez Sylvia
Home Financials for this Owner
Home Financials are based on the most recent Mortgage that was taken out on this home.
Original Mortgage
$96,000
Interest Rate
7.14%
Mortgage Type
New Conventional
Purchase Details
Closed on
May 6, 1994
Sold by
Okeefe Kathryn I and Okeefe James M
Bought by
Okeefe Kathryn I
Purchase Details
Closed on
Oct 27, 1993
Sold by
Okeefe Kathryn I and Okeefe James M
Bought by
Okeefe Kathryn I
Create a Home Valuation Report for This Property
The Home Valuation Report is an in-depth analysis detailing your home's value as well as a comparison with similar homes in the area
Home Values in the Area
Average Home Value in this Area
Purchase History
| Date | Buyer | Sale Price | Title Company |
|---|---|---|---|
| Martinez Jesus A | $166,200 | -- | |
| Fernandez Sylvia | $128,000 | -- | |
| Okeefe Kathryn I | -- | -- | |
| Okeefe Kathryn I | -- | -- |
Source: Public Records
Mortgage History
| Date | Status | Borrower | Loan Amount |
|---|---|---|---|
| Open | Fernandez Sylvia | $99,700 | |
| Previous Owner | Fernandez Sylvia | $96,000 |
Source: Public Records
Tax History Compared to Growth
Tax History
| Year | Tax Paid | Tax Assessment Tax Assessment Total Assessment is a certain percentage of the fair market value that is determined by local assessors to be the total taxable value of land and additions on the property. | Land | Improvement |
|---|---|---|---|---|
| 2024 | $4,784 | $235,516 | -- | -- |
| 2023 | $4,650 | $228,656 | $0 | $0 |
| 2022 | $4,461 | $221,996 | $0 | $0 |
| 2021 | $4,203 | $215,530 | $0 | $0 |
| 2020 | $4,116 | $212,554 | $0 | $0 |
| 2019 | $4,008 | $207,775 | $0 | $0 |
| 2018 | $3,913 | $203,901 | $0 | $0 |
| 2017 | $3,866 | $273,713 | $0 | $0 |
| 2016 | $3,829 | $195,599 | $0 | $0 |
| 2015 | $3,865 | $194,239 | $0 | $0 |
| 2014 | $3,838 | $192,697 | $0 | $0 |
| 2013 | -- | $189,849 | $0 | $0 |
Source: Public Records
Map
Nearby Homes
- 12002 Hope Ln
- 3011 Lake Ellen Dr
- 3026 Samara Dr
- 3155 Lake Ellen Dr
- 2531 Lake Ellen Dr
- 3307 Nakora Dr
- 2510 Lake Ellen Dr
- 2321 Carroll Grove Dr
- 2523 Krueger Ln
- 2521 Krueger Ln
- 2509 Lake Ellen Dr
- 2526 Lake Ellen Ln
- 10305 Orange Grove Dr
- 2525 Lake Ellen Ln
- 10504 Lacera Dr
- 2523 Lake Ellen Cir
- 2512 Lake Ellen Cir
- 2515 Lake Ellen Cir
- 11739 Wesson Cir W
- 12713 Sebring Blvd
- 3005 Peacock Ln
- 3001 Peacock Ln
- 3008 Sabal Rd
- 3010 Sabal Rd
- 3004 Peacock Ln
- 3002 Peacock Ln
- 11410 Carrollwood Dr
- 3007 Peacock Ln
- 3006 Peacock Ln
- 3012 Sabal Rd
- 3006 Sabal Rd
- 11502 Carrollwood Dr
- 3008 Peacock Ln
- 11320 Carrollwood Dr
- 3009 Peacock Ln
- 3004 Sabal Rd
- 3014 Sabal Rd
- 3009 Sabal Rd
- 11318 Carrollwood Dr
- 3003 Sabal Rd