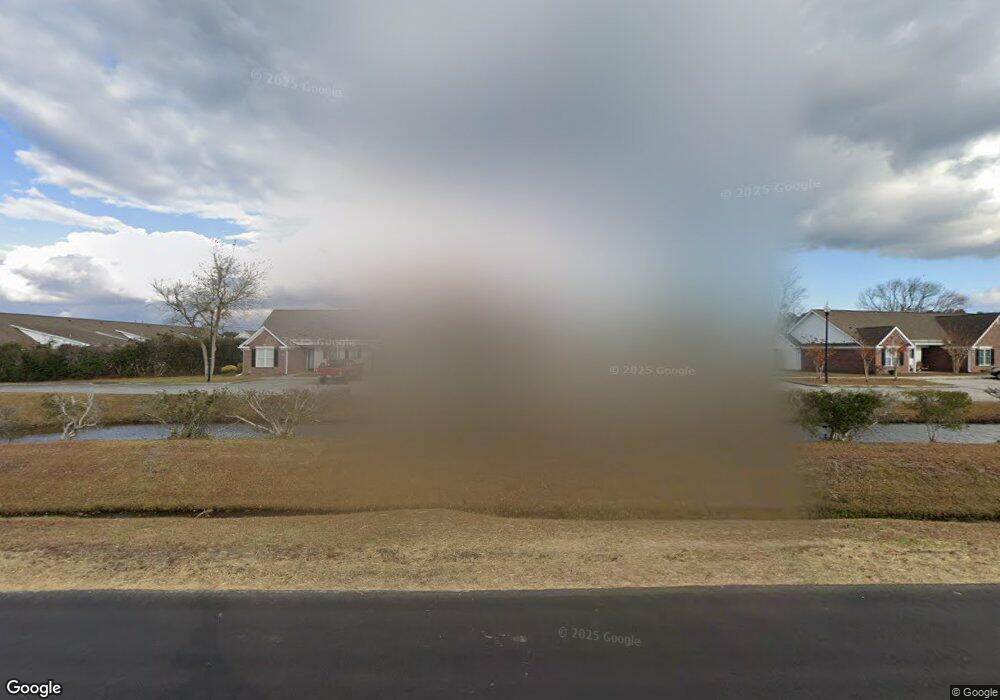
3004 Lauren Place Dr Wilmington, NC 28405
Estimated Value: $219,000 - $237,000
2
Beds
2
Baths
976
Sq Ft
$233/Sq Ft
Est. Value
About This Home
This home is located at 3004 Lauren Place Dr, Wilmington, NC 28405 and is currently estimated at $227,027, approximately $232 per square foot. 3004 Lauren Place Dr is a home located in New Hanover County with nearby schools including Castle Hayne Elementary School, Emma B. Trask Middle School, and Emsley A. Laney High School.
Ownership History
Date
Name
Owned For
Owner Type
Purchase Details
Closed on
Nov 13, 2020
Sold by
Greene Troy Allen and Greene Patricia
Bought by
Humphries Katherine M
Current Estimated Value
Home Financials for this Owner
Home Financials are based on the most recent Mortgage that was taken out on this home.
Original Mortgage
$142,373
Outstanding Balance
$128,129
Interest Rate
2.8%
Mortgage Type
FHA
Estimated Equity
$94,882
Purchase Details
Closed on
Aug 4, 2003
Sold by
Simmons Beverly Jean William H
Bought by
Myers Erin Gavin
Purchase Details
Closed on
Mar 29, 2001
Sold by
Ballard Joseph Todd Leanne P
Bought by
Kennedy Beverly Jean
Purchase Details
Closed on
Jul 3, 1996
Sold by
Eastwood Developers Llc
Bought by
Ballard Joseph Todd Leanne P
Purchase Details
Closed on
Dec 7, 1995
Sold by
Ammons Northchase Corp
Bought by
North Chase Venture Llc
Create a Home Valuation Report for This Property
The Home Valuation Report is an in-depth analysis detailing your home's value as well as a comparison with similar homes in the area
Home Values in the Area
Average Home Value in this Area
Purchase History
| Date | Buyer | Sale Price | Title Company |
|---|---|---|---|
| Humphries Katherine M | $145,000 | None Available | |
| Myers Erin Gavin | $78,500 | -- | |
| Kennedy Beverly Jean | $75,000 | -- | |
| Ballard Joseph Todd Leanne P | $66,500 | -- | |
| Eastwood Developers Llc | -- | -- | |
| North Chase Venture Llc | $300,000 | -- |
Source: Public Records
Mortgage History
| Date | Status | Borrower | Loan Amount |
|---|---|---|---|
| Open | Humphries Katherine Marie | $25,000 | |
| Open | Humphries Katherine M | $142,373 | |
| Previous Owner | Greene Troy Allen | $79,924 |
Source: Public Records
Tax History Compared to Growth
Tax History
| Year | Tax Paid | Tax Assessment Tax Assessment Total Assessment is a certain percentage of the fair market value that is determined by local assessors to be the total taxable value of land and additions on the property. | Land | Improvement |
|---|---|---|---|---|
| 2024 | $847 | $148,000 | $35,000 | $113,000 |
| 2023 | $841 | $148,000 | $35,000 | $113,000 |
| 2022 | $849 | $148,000 | $35,000 | $113,000 |
| 2021 | $822 | $148,000 | $35,000 | $113,000 |
| 2020 | $524 | $82,800 | $17,500 | $65,300 |
| 2019 | $524 | $82,800 | $17,500 | $65,300 |
| 2018 | $524 | $82,800 | $17,500 | $65,300 |
| 2017 | $536 | $82,800 | $17,500 | $65,300 |
| 2016 | $694 | $100,100 | $24,500 | $75,600 |
| 2015 | $645 | $100,100 | $24,500 | $75,600 |
| 2014 | $634 | $100,100 | $24,500 | $75,600 |
Source: Public Records
Map
Nearby Homes
- 3208 Ashborne Ct
- 5707 Mossberg Ct
- 3012 Remington Dr
- 3232 Belmont Cir
- 3308 Belmont Cir
- 2905 New Town Dr
- 3212 Belmont Cir
- 3206 Belmont Cir
- 4319 Lakemoor Dr
- 3113 Cabot Dr
- 2903 Hobart Dr
- 2801 Hobart Dr
- 4300 Pennhurst Ct
- 4315 Charthouse Dr
- 1174 Saint Augustine Dr
- 1218 Saint Augustine Dr
- 7016 Oxbow Loop
- 2007 N Kerr Ave
- 4814 Exton Park Loop
- 225 Candlewood Dr
- 3004 Lauren Place Dr
- 3004 Lauren Place Dr
- 3004 Lauren Place Dr
- 3004 Lauren Place Dr
- 3004 Lauren Place Dr
- 3004 Lauren Place Dr Unit 101
- 3004 Lauren Place Dr Unit 102
- 3004 Lauren Place Dr Unit 104
- 3004 Lauren Place Dr Unit 103
- 3004 Lauren Place Dr Unit 106
- 3011 Promenade Ct
- 3002 Lauren Place Dr
- 3002 Lauren Place Dr
- 3002 Lauren Place Dr
- 3002 Lauren Place Dr
- 3002 Lauren Place Dr Unit 101
- 3002 Lauren Place Dr Unit 104
- 3006 Lauren Place Dr Unit 103
- 3006 Lauren Place Dr Unit 105
- 3006 Lauren Place Dr