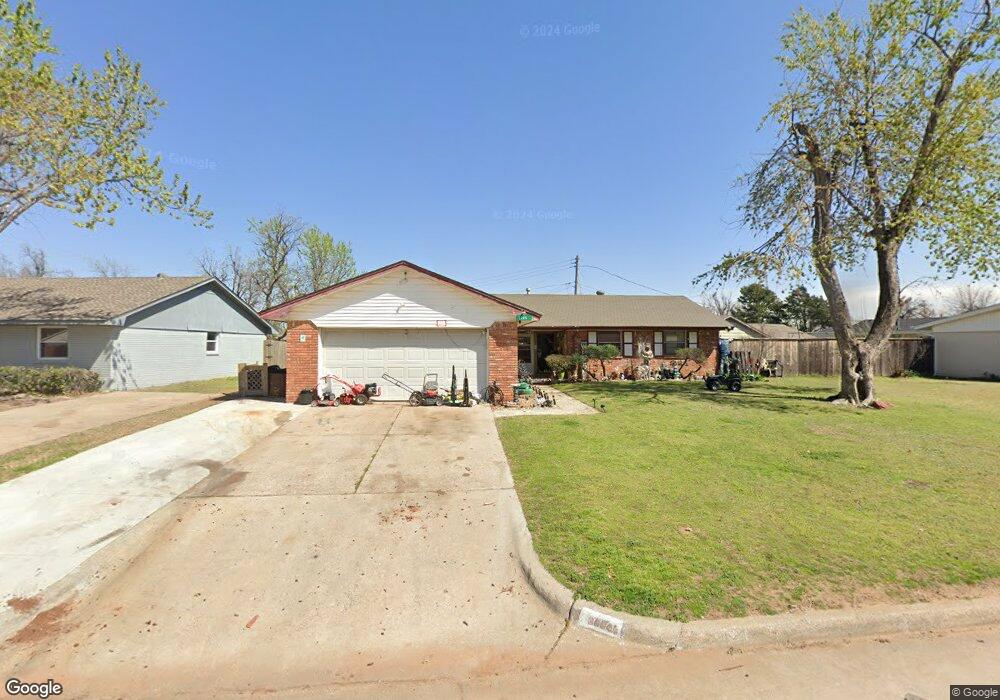
3004 N Thompkins Ave Bethany, OK 73008
Estimated Value: $194,000 - $214,000
3
Beds
2
Baths
1,517
Sq Ft
$132/Sq Ft
Est. Value
About This Home
This home is located at 3004 N Thompkins Ave, Bethany, OK 73008 and is currently estimated at $200,351, approximately $132 per square foot. 3004 N Thompkins Ave is a home located in Oklahoma County with nearby schools including Overholser Elementary School, Western Oaks Middle School, and Putnam City West High School.
Ownership History
Date
Name
Owned For
Owner Type
Purchase Details
Closed on
Sep 6, 2024
Sold by
Graham Jaime Kristen
Bought by
Graham Jaime Kristen
Current Estimated Value
Purchase Details
Closed on
Mar 31, 2014
Sold by
Ferguson Robert W and Ferguson Tammy L
Bought by
Smith Christopher L and Smith Jaime Graham
Home Financials for this Owner
Home Financials are based on the most recent Mortgage that was taken out on this home.
Original Mortgage
$98,090
Interest Rate
4.25%
Mortgage Type
FHA
Purchase Details
Closed on
Jan 5, 2006
Sold by
Rose Evalyn L and The Evalyn L Rose Revocable Tr
Bought by
Ferguson Robert W and Ferguson Tammy L
Home Financials for this Owner
Home Financials are based on the most recent Mortgage that was taken out on this home.
Original Mortgage
$96,139
Interest Rate
6.25%
Mortgage Type
FHA
Create a Home Valuation Report for This Property
The Home Valuation Report is an in-depth analysis detailing your home's value as well as a comparison with similar homes in the area
Home Values in the Area
Average Home Value in this Area
Purchase History
| Date | Buyer | Sale Price | Title Company |
|---|---|---|---|
| Graham Jaime Kristen | -- | None Listed On Document | |
| Smith Christopher L | $100,000 | Stewart Abstract & Title Of | |
| Ferguson Robert W | $97,000 | American Guaranty Title Co |
Source: Public Records
Mortgage History
| Date | Status | Borrower | Loan Amount |
|---|---|---|---|
| Previous Owner | Smith Christopher L | $98,090 | |
| Previous Owner | Ferguson Robert W | $96,139 |
Source: Public Records
Tax History Compared to Growth
Tax History
| Year | Tax Paid | Tax Assessment Tax Assessment Total Assessment is a certain percentage of the fair market value that is determined by local assessors to be the total taxable value of land and additions on the property. | Land | Improvement |
|---|---|---|---|---|
| 2024 | $1,974 | $16,846 | $3,186 | $13,660 |
| 2023 | $1,974 | $16,044 | $2,556 | $13,488 |
| 2022 | $1,720 | $15,280 | $2,743 | $12,537 |
| 2021 | $1,631 | $14,553 | $2,993 | $11,560 |
| 2020 | $1,548 | $13,860 | $3,031 | $10,829 |
| 2019 | $1,480 | $13,310 | $2,444 | $10,866 |
| 2018 | $1,410 | $12,760 | $0 | $0 |
| 2017 | $1,367 | $12,300 | $2,430 | $9,870 |
| 2016 | $1,283 | $11,714 | $2,444 | $9,270 |
| 2015 | $1,187 | $11,217 | $2,502 | $8,715 |
| 2014 | $1,133 | $11,179 | $2,502 | $8,677 |
Source: Public Records
Map
Nearby Homes
- 7728 NW 30th St
- 3120 N Pinecrest Dr
- 7433 NW 31st St
- 7525 NW 25th Terrace
- 7521 NW 25th Terrace
- 8008 NW 27th St
- 7401 NW 28th Terrace
- 7401 NW 30th Terrace
- 7525 NW 25th St
- 3129 N Timber Ave
- 8209 NW 28th St
- 7800 NW 37th St
- 2912 N Shannon Ave
- 8213 NW 25th St
- 2928 N Downing Ave
- 7113 NW 30th Terrace
- 3725 N Grant Ave
- 7104 NW 32nd St
- 8004 NW 20th St
- 2601 N Rockwell Ave
- 3008 N Thompkins Ave
- 7733 NW 29th St
- 7729 NW 29th St
- 7725 NW 29th St
- 7736 NW 30th St
- 7732 NW 30th St
- 3009 N Thompkins Ave
- 3005 N Thompkins Ave
- 3013 N Thompkins Ave
- 7721 NW 29th St
- 7801 NW 29th St
- 3017 N Thompkins Ave
- 7724 NW 30th St
- 7724 NW 29th St
- 7728 NW 29th St
- 3021 N Thompkins Ave
- 7720 NW 29th St
- 7717 NW 29th St
- 7720 NW 30th St
- 7732 NW 29th St