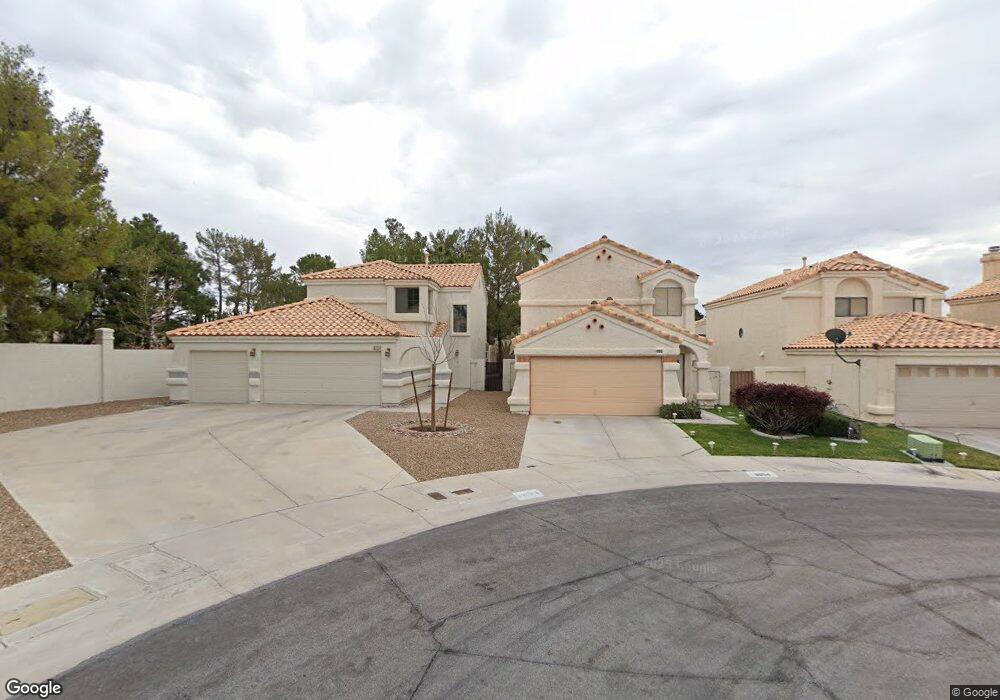
3004 Old Salt Cir Las Vegas, NV 89117
The Section Seven NeighborhoodEstimated Value: $495,000 - $573,000
4
Beds
3
Baths
2,080
Sq Ft
$255/Sq Ft
Est. Value
About This Home
This home is located at 3004 Old Salt Cir, Las Vegas, NV 89117 and is currently estimated at $530,913, approximately $255 per square foot. 3004 Old Salt Cir is a home located in Clark County with nearby schools including M J Christensen Elementary School, Clifford J Lawrence Junior High School, and Bonanza High School.
Ownership History
Date
Name
Owned For
Owner Type
Purchase Details
Closed on
Jul 26, 2000
Sold by
Patterson Mark W and Patterson Janet
Bought by
Moore Lawrence and Moore Barbara J
Current Estimated Value
Home Financials for this Owner
Home Financials are based on the most recent Mortgage that was taken out on this home.
Original Mortgage
$147,600
Outstanding Balance
$66,921
Interest Rate
11.86%
Estimated Equity
$463,992
Purchase Details
Closed on
Apr 15, 1994
Sold by
Harris Mavis L and Montgomery James R
Bought by
Patterson Mark W and Patterson Janet S
Home Financials for this Owner
Home Financials are based on the most recent Mortgage that was taken out on this home.
Original Mortgage
$130,150
Interest Rate
8.3%
Create a Home Valuation Report for This Property
The Home Valuation Report is an in-depth analysis detailing your home's value as well as a comparison with similar homes in the area
Home Values in the Area
Average Home Value in this Area
Purchase History
| Date | Buyer | Sale Price | Title Company |
|---|---|---|---|
| Moore Lawrence | $164,000 | Lawyers Title | |
| Patterson Mark W | $137,000 | Old Republic Title Company |
Source: Public Records
Mortgage History
| Date | Status | Borrower | Loan Amount |
|---|---|---|---|
| Open | Moore Lawrence | $147,600 | |
| Previous Owner | Patterson Mark W | $130,150 | |
| Closed | Moore Lawrence | $147,600 |
Source: Public Records
Tax History Compared to Growth
Tax History
| Year | Tax Paid | Tax Assessment Tax Assessment Total Assessment is a certain percentage of the fair market value that is determined by local assessors to be the total taxable value of land and additions on the property. | Land | Improvement |
|---|---|---|---|---|
| 2025 | $2,107 | $97,644 | $42,000 | $55,644 |
| 2024 | $2,046 | $97,644 | $42,000 | $55,644 |
| 2023 | $2,046 | $89,613 | $36,050 | $53,563 |
| 2022 | $1,987 | $77,600 | $28,350 | $49,250 |
| 2021 | $1,929 | $75,599 | $28,350 | $47,249 |
| 2020 | $1,870 | $72,697 | $25,550 | $47,147 |
| 2019 | $1,815 | $68,482 | $21,700 | $46,782 |
| 2018 | $1,762 | $66,443 | $21,350 | $45,093 |
| 2017 | $2,195 | $66,950 | $21,000 | $45,950 |
| 2016 | $1,669 | $60,438 | $14,000 | $46,438 |
| 2015 | $1,665 | $49,276 | $10,150 | $39,126 |
| 2014 | $1,617 | $50,174 | $7,700 | $42,474 |
Source: Public Records
Map
Nearby Homes
- 9429 Abalone Way
- 3009 Periscope Ct
- 9548 Wooden Pier Way
- 9605 Blowing Sand Cir
- 9504 Cliff View Way
- 9713 Cascade Falls Ave
- 9624 Beach Water Cir
- 9724 Cascade Falls Ave
- 2913 Domino Way
- 9708 Blazing Star Ct
- 9544 Lazy River Dr
- 3001 Bridge Creek St
- 9717 Sierra Mesa Ave
- 3040 Ocean Port Dr
- 9312 Angelfish Dr
- 3213 Shallow Point Cir
- 9113 Anchor Cove Ct
- 2728 Monrovia Dr
- 2724 Monrovia Dr
- 9100 Shelter Cove Ct
- 3008 Old Salt Cir
- 3000 Old Salt Cir Unit 2
- 3012 Old Salt Cir
- 3009 Ocean View Dr
- 3016 Old Salt Cir
- 3013 Ocean View Dr
- 3001 Ocean View Dr
- 3001 Old Salt Cir
- 3017 Ocean View Dr
- 3020 Old Salt Cir Unit 2
- 3021 Ocean View Dr
- 3009 Old Salt Cir
- 3013 Old Salt Cir
- 3024 Old Salt Cir
- 9505 Bottle Creek Ln Unit 2
- 3017 Old Salt Cir Unit 2
- 9501 Bottle Creek Ln Unit n/a
- 9501 Bottle Creek Ln
- 3025 Ocean View Dr