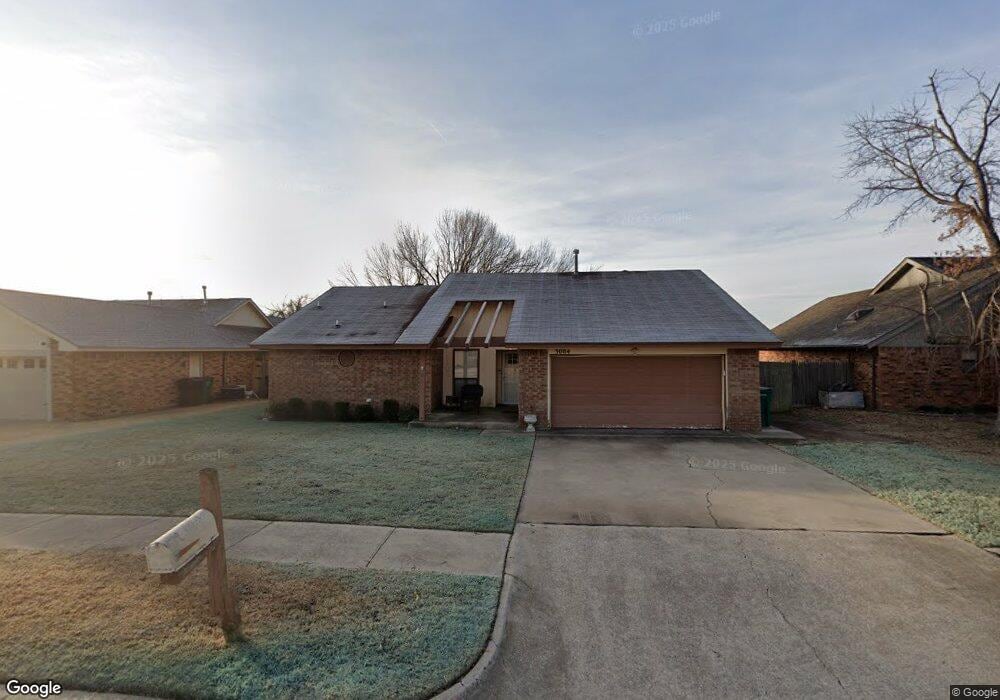
3004 SW 128th St Oklahoma City, OK 73170
Earlywine NeighborhoodEstimated Value: $209,000 - $230,000
3
Beds
2
Baths
1,565
Sq Ft
$139/Sq Ft
Est. Value
About This Home
This home is located at 3004 SW 128th St, Oklahoma City, OK 73170 and is currently estimated at $217,414, approximately $138 per square foot. 3004 SW 128th St is a home located in Cleveland County with nearby schools including Earlywine Elementary School, Brink Junior High School, and Westmoore High School.
Ownership History
Date
Name
Owned For
Owner Type
Purchase Details
Closed on
Apr 23, 2013
Sold by
Gennings Barry Wade and Gennings Tonya Denise
Bought by
Gennings Tonya Denise
Current Estimated Value
Home Financials for this Owner
Home Financials are based on the most recent Mortgage that was taken out on this home.
Original Mortgage
$94,500
Outstanding Balance
$44,135
Interest Rate
3.67%
Mortgage Type
New Conventional
Estimated Equity
$173,279
Purchase Details
Closed on
Apr 22, 2013
Sold by
Gennings Barry W
Bought by
Gennings Tonya D
Home Financials for this Owner
Home Financials are based on the most recent Mortgage that was taken out on this home.
Original Mortgage
$94,500
Outstanding Balance
$44,135
Interest Rate
3.67%
Mortgage Type
New Conventional
Estimated Equity
$173,279
Purchase Details
Closed on
Nov 29, 2005
Sold by
Gennings Barry W and Gennings Tonya D
Bought by
Gennings Barry Wade and Gennings Tonya Denise
Purchase Details
Closed on
Apr 29, 2002
Sold by
Molleda Sandra
Bought by
Gennings Barry W and Gennings Tonya D
Create a Home Valuation Report for This Property
The Home Valuation Report is an in-depth analysis detailing your home's value as well as a comparison with similar homes in the area
Home Values in the Area
Average Home Value in this Area
Purchase History
| Date | Buyer | Sale Price | Title Company |
|---|---|---|---|
| Gennings Tonya Denise | -- | First American Title & Abs | |
| Gennings Tonya D | -- | First American Title & Abstr | |
| Gennings Barry Wade | -- | None Available | |
| Gennings Barry W | $95,500 | -- |
Source: Public Records
Mortgage History
| Date | Status | Borrower | Loan Amount |
|---|---|---|---|
| Open | Gennings Tonya Denise | $94,500 |
Source: Public Records
Tax History Compared to Growth
Tax History
| Year | Tax Paid | Tax Assessment Tax Assessment Total Assessment is a certain percentage of the fair market value that is determined by local assessors to be the total taxable value of land and additions on the property. | Land | Improvement |
|---|---|---|---|---|
| 2024 | $2,170 | $17,835 | $4,269 | $13,566 |
| 2023 | $2,077 | $16,986 | $6,249 | $10,737 |
| 2022 | $2,003 | $16,177 | $3,640 | $12,537 |
| 2021 | $1,903 | $15,406 | $3,000 | $12,406 |
| 2020 | $1,825 | $14,715 | $2,943 | $11,772 |
| 2019 | $1,758 | $14,014 | $3,000 | $11,014 |
| 2018 | $1,907 | $15,022 | $2,968 | $12,054 |
| 2017 | $1,817 | $15,185 | $0 | $0 |
| 2016 | $1,749 | $13,625 | $2,692 | $10,933 |
| 2015 | $1,539 | $12,976 | $2,665 | $10,311 |
| 2014 | $1,491 | $12,358 | $1,716 | $10,642 |
Source: Public Records
Map
Nearby Homes
- 2930 SW 127th St
- 2940 SW 125th St
- 3033 SW 126th St
- 3121 SW 128th St
- 13400 Lisbon Ave
- 3201 SW 131st St
- 2917 SW 124th Ct
- 13408 Lisbon Ave
- 13404 Lisbon Ave
- 13400 Sandoval St
- 13304 Lisbon Ave
- 13313 Porto Ln
- 13405 Lisbon Ave
- 13401 Porto Ln
- 13408 Sandoval St
- 13305 Porto Ln
- 12556 Crick Hollow Ct
- 25514 S May Ave
- 12505 Shire Ln
- 12308 Bywater Rd
- 3008 SW 128th St
- 3000 SW 128th St
- 3012 SW 128th St
- 2940 SW 128th St
- 3005 SW 128th St
- 3001 SW 128th St
- 3009 SW 128th St
- 3005 SW 129th St
- 3009 SW 129th St
- 3001 SW 129th St
- 2936 SW 128th St
- 3016 SW 128th St
- 2941 SW 128th St
- 3013 SW 129th St
- 2941 SW 129th St
- 3013 SW 128th St
- 2937 SW 128th St
- 3017 SW 128th St
- 2932 SW 128th St
- 2937 SW 129th St