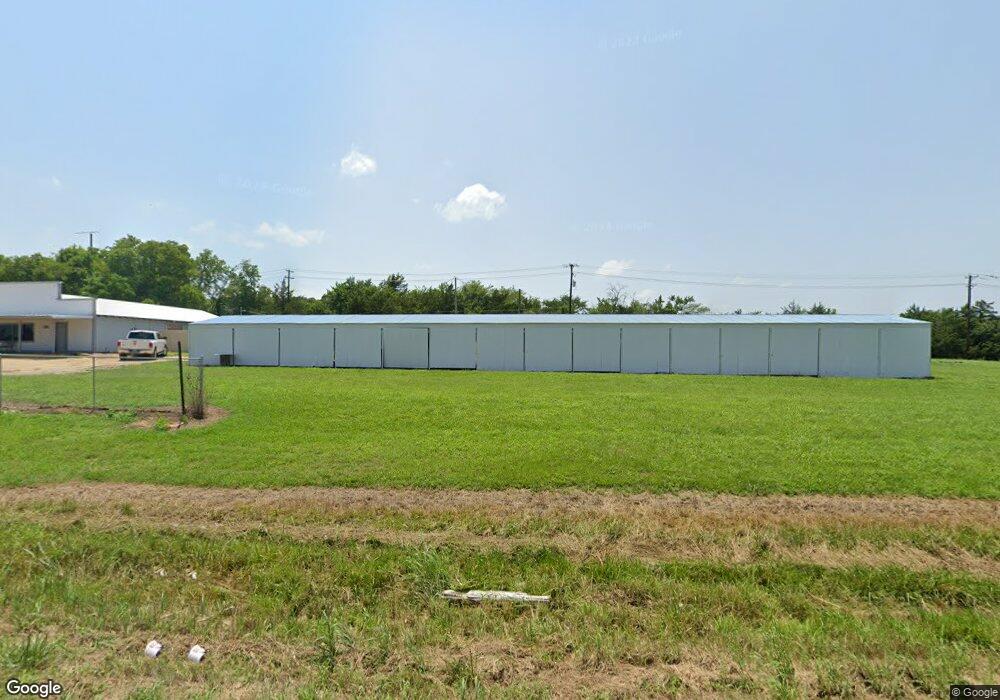
30040 N Sh 289 Pottsboro, TX 75076
Estimated Value: $649,000
--
Bed
--
Bath
1,816
Sq Ft
$357/Sq Ft
Est. Value
About This Home
This home is located at 30040 N Sh 289, Pottsboro, TX 75076 and is currently estimated at $649,000, approximately $357 per square foot. 30040 N Sh 289 is a home with nearby schools including Pottsboro Elementary School, Pottsboro Middle School, and Pottsboro High School.
Ownership History
Date
Name
Owned For
Owner Type
Purchase Details
Closed on
Dec 30, 2021
Sold by
Brown House Holdings Llc
Bought by
Baxley Scott
Current Estimated Value
Home Financials for this Owner
Home Financials are based on the most recent Mortgage that was taken out on this home.
Original Mortgage
$20,000
Outstanding Balance
$18,432
Interest Rate
3.11%
Mortgage Type
Commercial
Estimated Equity
$630,568
Purchase Details
Closed on
Apr 8, 2015
Sold by
Light Allen
Bought by
Baldridge William Keith
Purchase Details
Closed on
May 1, 2008
Sold by
Mckeen James J and Mckeen Sara N
Bought by
Maier Louie Wayne
Home Financials for this Owner
Home Financials are based on the most recent Mortgage that was taken out on this home.
Original Mortgage
$53,216
Interest Rate
6.11%
Mortgage Type
Seller Take Back
Create a Home Valuation Report for This Property
The Home Valuation Report is an in-depth analysis detailing your home's value as well as a comparison with similar homes in the area
Home Values in the Area
Average Home Value in this Area
Purchase History
| Date | Buyer | Sale Price | Title Company |
|---|---|---|---|
| Baxley Scott | -- | None Available | |
| Baldridge William Keith | -- | Grayson County Title | |
| Maier Louie Wayne | -- | None Available |
Source: Public Records
Mortgage History
| Date | Status | Borrower | Loan Amount |
|---|---|---|---|
| Open | Baxley Scott | $20,000 | |
| Previous Owner | Maier Louie Wayne | $53,216 |
Source: Public Records
Tax History Compared to Growth
Tax History
| Year | Tax Paid | Tax Assessment Tax Assessment Total Assessment is a certain percentage of the fair market value that is determined by local assessors to be the total taxable value of land and additions on the property. | Land | Improvement |
|---|---|---|---|---|
| 2025 | $8,622 | $491,417 | -- | -- |
| 2024 | $8,622 | $446,743 | $217,530 | $229,213 |
| 2023 | $7,002 | $330,485 | $187,727 | $142,758 |
| 2022 | $5,313 | $250,755 | $201,008 | $49,747 |
| 2021 | $2,697 | $121,571 | $80,842 | $40,729 |
| 2020 | $2,614 | $114,067 | $72,821 | $41,246 |
| 2019 | $2,737 | $114,067 | $72,072 | $41,995 |
| 2018 | $2,886 | $119,138 | $72,072 | $47,066 |
| 2017 | $2,564 | $104,628 | $55,762 | $48,866 |
| 2016 | $2,636 | $107,559 | $57,657 | $49,902 |
| 2015 | $0 | $108,482 | $57,657 | $50,825 |
| 2014 | -- | $107,202 | $55,226 | $51,976 |
Source: Public Records
Map
Nearby Homes
- 3.269 AC Texas 289
- 705 Texas 289
- 297 Cemetery Rd
- 1016 Fountain Creek Blvd
- 20 AC Preston Bend Rd
- 49 AC Preston Bend Rd
- 1026 Addison Ave
- 2033 Nichole Blvd
- 1131 Fountain Creek Blvd
- 1023 Teagan Ct
- 133 S Meadowbrook Dr
- 3.269 Ac Sh 289
- 165 Willow Tree Ln
- 118 Texoma Meadows
- 107 Fountain Meadows
- 113 Rock Hill Rd
- 101 Rock Hill Rd
- TBD Pearce Dr
- 111 Prairie Meadow Ln
- 200 Clement Ct
- 30040 Texas 289
- 30040 N State Hwy 289
- 110 Cemetery Rd
- 3.269 Texas 289
- 30015 N Sh 289
- 10TBD Cemetery Rd
- 00 Cemetery Rd
- 0 Cemetery Rd
- 30035 N State Hwy 289
- 175 Cemetery Rd
- 186 Reeves Rd
- 289 N Highway 289 St
- 180 Cemetery Rd
- 3+ Ac State Highway 289
- 195 Cemetery Rd
- 30050 N State Hwy 289
- 30050 N State Highway 289
- 30050 N State Hwy 289
- 280 Cemetery Rd
- 289 N Highway 289 St