3005 236th St NE Arlington, WA 98223
Estimated Value: $839,741
3
Beds
2
Baths
1,744
Sq Ft
$482/Sq Ft
Est. Value
About This Home
This home is located at 3005 236th St NE, Arlington, WA 98223 and is currently estimated at $839,741, approximately $481 per square foot. 3005 236th St NE is a home located in Snohomish County with nearby schools including Presidents Elementary School, Haller Middle School, and Weston High School.
Ownership History
Date
Name
Owned For
Owner Type
Purchase Details
Closed on
May 7, 2015
Sold by
Stillaguamish Tribe Of Indians
Bought by
United States Of America In Trust and The Stillaguamish Tribe Of Indians
Current Estimated Value
Purchase Details
Closed on
Jan 13, 2015
Sold by
Roller William E and Roller Janet A
Bought by
Stillaguamish Tribe Of Indians
Purchase Details
Closed on
Sep 24, 1999
Sold by
Flood Michael J and Flood Judi M
Bought by
Roller William E and Roller Janet A
Home Financials for this Owner
Home Financials are based on the most recent Mortgage that was taken out on this home.
Original Mortgage
$196,000
Interest Rate
8.09%
Purchase Details
Closed on
Jan 10, 1994
Sold by
Dry Ted R and Dry Jodie C
Bought by
Flood Michael J and Flood Judi M
Home Financials for this Owner
Home Financials are based on the most recent Mortgage that was taken out on this home.
Original Mortgage
$161,400
Interest Rate
4.37%
Create a Home Valuation Report for This Property
The Home Valuation Report is an in-depth analysis detailing your home's value as well as a comparison with similar homes in the area
Home Values in the Area
Average Home Value in this Area
Purchase History
| Date | Buyer | Sale Price | Title Company |
|---|---|---|---|
| United States Of America In Trust | -- | None Available | |
| Stillaguamish Tribe Of Indians | $345,000 | Chicago Title | |
| Roller William E | $245,000 | First American Title Ins Co | |
| Flood Michael J | $189,900 | Chicago Title Insurance Co |
Source: Public Records
Mortgage History
| Date | Status | Borrower | Loan Amount |
|---|---|---|---|
| Previous Owner | Roller William E | $196,000 | |
| Previous Owner | Flood Michael J | $161,400 |
Source: Public Records
Tax History Compared to Growth
Tax History
| Year | Tax Paid | Tax Assessment Tax Assessment Total Assessment is a certain percentage of the fair market value that is determined by local assessors to be the total taxable value of land and additions on the property. | Land | Improvement |
|---|---|---|---|---|
| 2025 | -- | $258,800 | $258,800 | -- |
| 2024 | -- | $226,900 | $226,900 | -- |
| 2023 | -- | $212,900 | $212,900 | -- |
| 2022 | -- | $535,000 | $227,600 | $307,400 |
| 2020 | $0 | $451,600 | $179,300 | $272,300 |
| 2019 | $0 | $421,700 | $164,400 | $257,300 |
| 2018 | $4,608 | $393,000 | $151,400 | $241,600 |
| 2017 | $4,608 | $337,300 | $104,900 | $232,400 |
| 2016 | $4,608 | $334,600 | $110,400 | $224,200 |
| 2015 | $4,608 | $325,100 | $122,400 | $202,700 |
| 2013 | $3,866 | $255,000 | $88,400 | $166,600 |
Source: Public Records
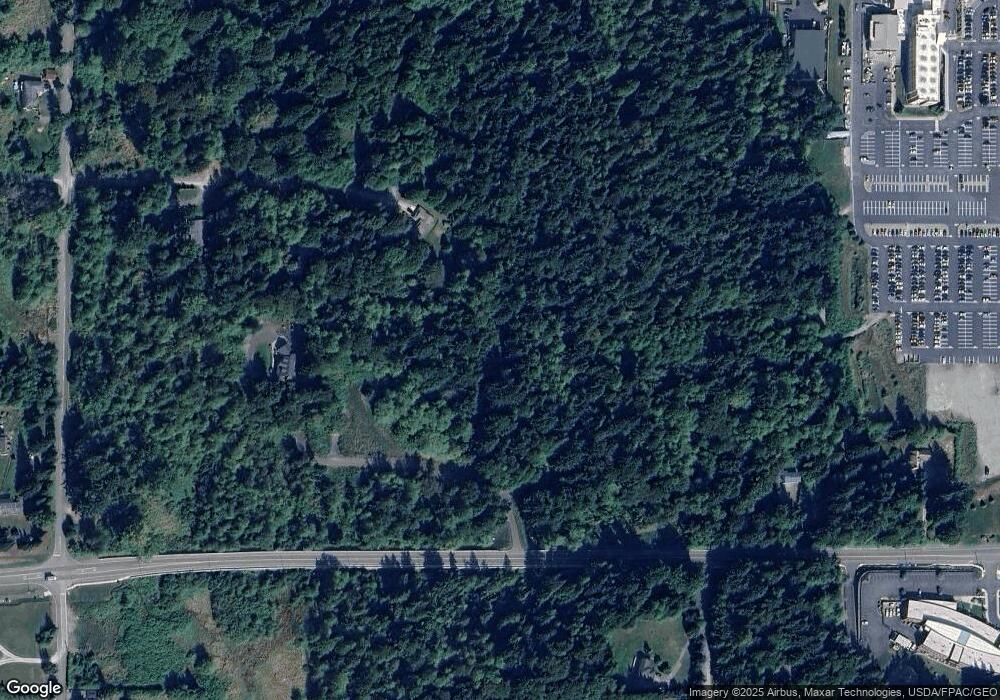
Map
Nearby Homes
- 3630 252nd St NE
- 24422 19th Ave NE
- 25204 19th Ave NE
- 3830 257th St NE
- 25106 47th Ave NE
- 4718 252nd St NE
- 5222 233rd Place NE
- 25606 Mountain Dr
- 2714 268th St NE
- 21916 7th Ave NE
- 20102 33rd Ave NE
- 20217 45th Dr NE
- 5628 Grandview Rd
- 27621 35th Ave NE
- 26306 2nd Ave NE
- 26807 3rd Ave NE
- 4502 200th St NE
- 26913 3rd Ave NE
- 19605 Smokey Point Blvd
- 26927 3rd Ave NE
- 3007 236th St NE
- 23829 27th Ave NE
- 2909 236th St NE
- 23609 27th Ave NE
- 2833 236th St NE
- 23825 27th Ave NE
- 23913 27th Ave NE
- 23821 27th Ave NE
- 3127 236th St NE
- 23516 32nd Ave NE
- 23826 35th Ave NE
- 23515 32nd Ave NE
- 23414 32nd Ave NE
- 24027 27th Ave NE
- 3311 236th St NE
- 23917 27th Ave NE
- 2710 236th St NE
- 23417 32nd Ave NE
- 24121 27th Ave NE
- 2621 236th St NE