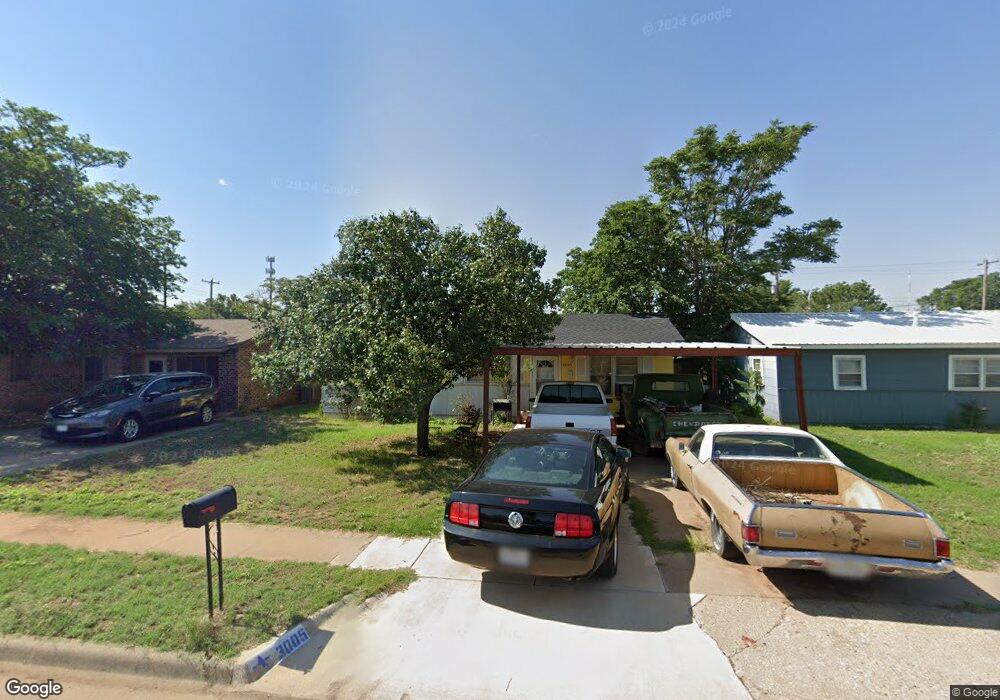
3005 2nd Place Lubbock, TX 79415
Arnett Benson NeighborhoodEstimated Value: $79,000 - $98,000
3
Beds
1
Bath
912
Sq Ft
$97/Sq Ft
Est. Value
About This Home
This home is located at 3005 2nd Place, Lubbock, TX 79415 and is currently estimated at $88,825, approximately $97 per square foot. 3005 2nd Place is a home located in Lubbock County with nearby schools including McWhorter Elementary School, Cavazos Middle School, and Lubbock High School.
Ownership History
Date
Name
Owned For
Owner Type
Purchase Details
Closed on
Dec 22, 2010
Sold by
Rangel Steven and Rangel Eva S
Bought by
Delos Santos Sarah and Delos Santos Rafael
Current Estimated Value
Home Financials for this Owner
Home Financials are based on the most recent Mortgage that was taken out on this home.
Original Mortgage
$38,481
Outstanding Balance
$25,617
Interest Rate
4.37%
Mortgage Type
FHA
Estimated Equity
$63,208
Purchase Details
Closed on
Feb 24, 1998
Sold by
Rangel John P
Bought by
Delos Santos Sarah and Delos Rafael
Purchase Details
Closed on
Nov 1, 1983
Bought by
Delos Santos Sarah and Delos Rafael
Create a Home Valuation Report for This Property
The Home Valuation Report is an in-depth analysis detailing your home's value as well as a comparison with similar homes in the area
Home Values in the Area
Average Home Value in this Area
Purchase History
| Date | Buyer | Sale Price | Title Company |
|---|---|---|---|
| Delos Santos Sarah | -- | Western Title Company | |
| Delos Santos Sarah | -- | -- | |
| Delos Santos Sarah | -- | -- |
Source: Public Records
Mortgage History
| Date | Status | Borrower | Loan Amount |
|---|---|---|---|
| Open | Delos Santos Sarah | $38,481 |
Source: Public Records
Tax History
| Year | Tax Paid | Tax Assessment Tax Assessment Total Assessment is a certain percentage of the fair market value that is determined by local assessors to be the total taxable value of land and additions on the property. | Land | Improvement |
|---|---|---|---|---|
| 2025 | $451 | $73,890 | $15,500 | $58,390 |
| 2024 | $12 | $73,078 | $2,250 | $70,828 |
| 2023 | $288 | $59,949 | $2,250 | $57,699 |
| 2022 | $1,159 | $57,231 | $2,250 | $61,154 |
| 2021 | $1,084 | $50,620 | $2,250 | $48,370 |
| 2020 | $957 | $44,024 | $2,250 | $41,774 |
| 2019 | $988 | $44,024 | $2,250 | $41,774 |
| 2018 | $954 | $42,454 | $2,250 | $40,204 |
| 2017 | $821 | $36,486 | $2,250 | $34,236 |
| 2016 | $841 | $37,371 | $1,250 | $36,121 |
| 2015 | $766 | $37,380 | $1,250 | $36,130 |
| 2014 | $766 | $34,431 | $1,250 | $33,181 |
Source: Public Records
Map
Nearby Homes
Your Personal Tour Guide
Ask me questions while you tour the home.