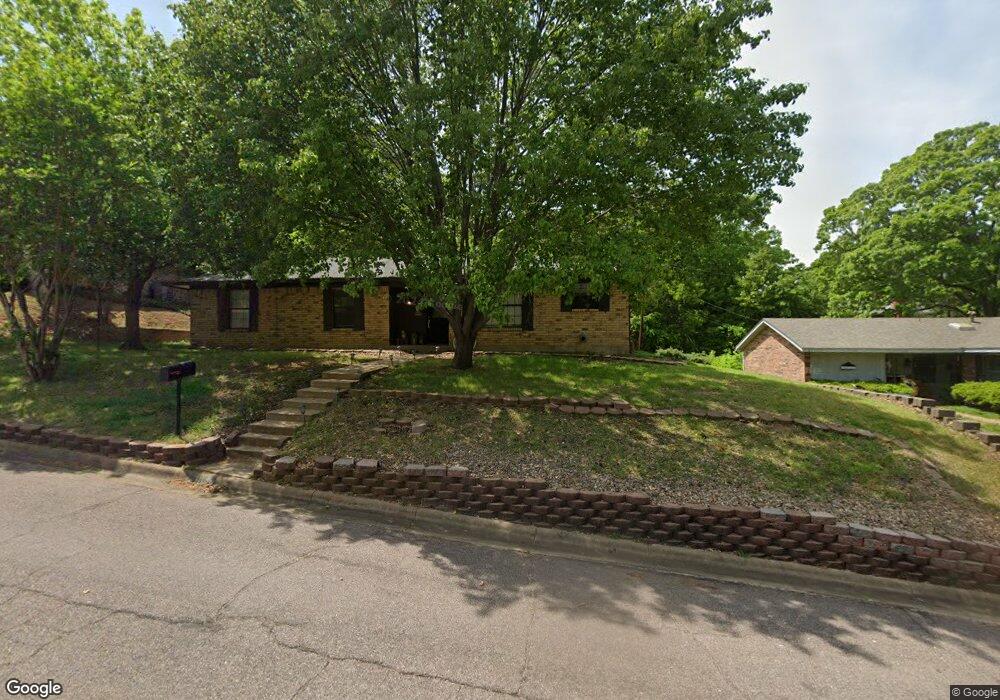
3005 Belle Ave Denison, TX 75020
Estimated Value: $217,784 - $263,000
3
Beds
2
Baths
1,437
Sq Ft
$167/Sq Ft
Est. Value
About This Home
This home is located at 3005 Belle Ave, Denison, TX 75020 and is currently estimated at $240,392, approximately $167 per square foot. 3005 Belle Ave is a home located in Grayson County with nearby schools including Hyde Park Elementary School, Scott Middle School, and Denison High School.
Ownership History
Date
Name
Owned For
Owner Type
Purchase Details
Closed on
Jun 26, 2020
Sold by
Prseton Forrest Holdings Llc
Bought by
Mcgehee Cassie L
Current Estimated Value
Home Financials for this Owner
Home Financials are based on the most recent Mortgage that was taken out on this home.
Original Mortgage
$160,047
Outstanding Balance
$142,182
Interest Rate
3.2%
Mortgage Type
FHA
Estimated Equity
$98,210
Purchase Details
Closed on
Jan 1, 2019
Sold by
Preston Forrest Holdings Llc
Bought by
Preston Forrest Holdings Llc Series 4 Ps
Purchase Details
Closed on
Dec 18, 2015
Sold by
Holzbog Cornelia F
Bought by
Preston Forrest Holdings Llc
Home Financials for this Owner
Home Financials are based on the most recent Mortgage that was taken out on this home.
Original Mortgage
$89,000
Interest Rate
4.03%
Mortgage Type
Commercial
Create a Home Valuation Report for This Property
The Home Valuation Report is an in-depth analysis detailing your home's value as well as a comparison with similar homes in the area
Home Values in the Area
Average Home Value in this Area
Purchase History
| Date | Buyer | Sale Price | Title Company |
|---|---|---|---|
| Mcgehee Cassie L | -- | Grayson County Title | |
| Preston Forrest Holdings Llc Series 4 Ps | $89,000 | None Available | |
| Preston Forrest Holdings Llc | -- | Grayson County Title |
Source: Public Records
Mortgage History
| Date | Status | Borrower | Loan Amount |
|---|---|---|---|
| Open | Mcgehee Cassie L | $160,047 | |
| Previous Owner | Preston Forrest Holdings Llc | $89,000 |
Source: Public Records
Tax History Compared to Growth
Tax History
| Year | Tax Paid | Tax Assessment Tax Assessment Total Assessment is a certain percentage of the fair market value that is determined by local assessors to be the total taxable value of land and additions on the property. | Land | Improvement |
|---|---|---|---|---|
| 2025 | $4,975 | $237,413 | $64,818 | $172,595 |
| 2024 | $4,975 | $214,138 | $42,900 | $171,238 |
| 2023 | $4,947 | $218,341 | $42,666 | $175,675 |
| 2022 | $4,502 | $189,503 | $42,666 | $146,837 |
| 2021 | $4,023 | $159,527 | $30,420 | $129,107 |
| 2020 | $3,946 | $149,598 | $18,564 | $131,034 |
| 2019 | $4,139 | $150,406 | $18,564 | $131,842 |
| 2018 | $3,590 | $129,400 | $11,778 | $117,622 |
| 2017 | $3,026 | $108,150 | $11,778 | $96,372 |
| 2016 | $3,967 | $104,266 | $11,778 | $92,488 |
| 2015 | $781 | $85,398 | $11,778 | $73,620 |
| 2014 | $931 | $82,798 | $11,778 | $71,020 |
Source: Public Records
Map
Nearby Homes
- 1803 Woodland Park Dr
- 2100 Deer Run
- 1838 Park Ave
- 2131 Deer Run
- 2111 Renaissance Dr
- 2108 Turtlecreek
- 527 W Coffin St
- 1130 Amsden Cir
- 3312 Vine Ln
- 1901 Woodlawn Blvd
- 2206 Bluebonnet Ave
- 3101 S College Blvd
- 2406 Loy Lake Rd
- 938 Amsden St
- 1830 Clark Dr
- 923 Dubois St
- 0 S Maurice Ave
- 2606 Easy St
- 919 W Collins St
- TBD Bluebonnet Ave
- 3011 Belle Ave
- 3001 Belle Ave
- 3004 Belle Ave
- 3000 Belle Ave
- 3000 Frances Dr
- 3013 Belle Ave
- 3012 Belle Ave
- 3018 Frances Dr
- 3014 Belle Ave
- 3015 Belle Ave
- 3009 Frances Dr
- 3005 Frances Dr
- 3026 Frances Dr
- 3011 Frances Dr
- 3021 Belle Ave
- 3001 Frances Dr
- 3015 Frances Dr
- 3026 Belle Ave
- 3028 Frances Dr
- 3025 Belle Ave