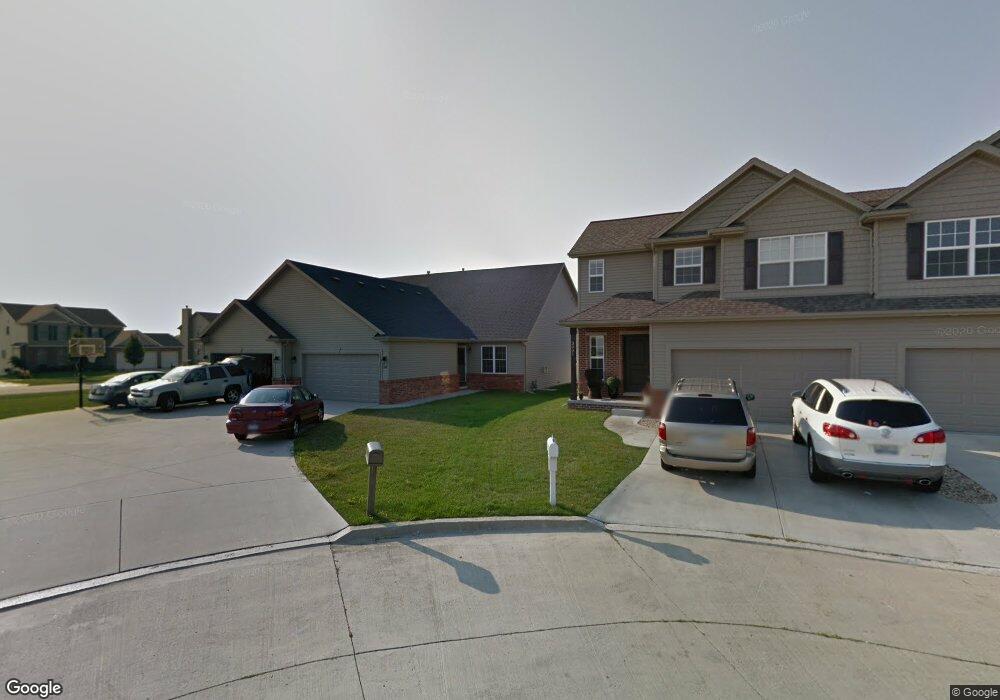
3005 E Raab Rd Normal, IL 61761
Eagles Landing NeighborhoodEstimated Value: $248,904 - $313,000
3
Beds
3
Baths
1,694
Sq Ft
$172/Sq Ft
Est. Value
About This Home
This home is located at 3005 E Raab Rd, Normal, IL 61761 and is currently estimated at $290,976, approximately $171 per square foot. 3005 E Raab Rd is a home located in McLean County with nearby schools including Grove Elementary School, Chiddix Junior High School, and Normal Community High School.
Ownership History
Date
Name
Owned For
Owner Type
Purchase Details
Closed on
Nov 16, 2021
Sold by
Dunson Dorian and Dunson Jacqueline
Bought by
Dunson Dorian and Dunson Jacqueline
Current Estimated Value
Purchase Details
Closed on
Sep 11, 2006
Sold by
Hopkins Grant
Bought by
Dunson Dorian and Dunson Jacqueline
Home Financials for this Owner
Home Financials are based on the most recent Mortgage that was taken out on this home.
Original Mortgage
$175,000
Interest Rate
7.5%
Mortgage Type
Adjustable Rate Mortgage/ARM
Purchase Details
Closed on
Sep 19, 2005
Sold by
Kaisner Corp
Bought by
Hopkins Grant
Home Financials for this Owner
Home Financials are based on the most recent Mortgage that was taken out on this home.
Original Mortgage
$40,800
Interest Rate
6.01%
Create a Home Valuation Report for This Property
The Home Valuation Report is an in-depth analysis detailing your home's value as well as a comparison with similar homes in the area
Home Values in the Area
Average Home Value in this Area
Purchase History
| Date | Buyer | Sale Price | Title Company |
|---|---|---|---|
| Dunson Dorian | -- | None Listed On Document | |
| Dunson Dorian | $175,000 | First American Title | |
| Hopkins Grant | $48,000 | None Available |
Source: Public Records
Mortgage History
| Date | Status | Borrower | Loan Amount |
|---|---|---|---|
| Previous Owner | Dunson Dorian | $175,000 | |
| Previous Owner | Hopkins Grant | $40,800 |
Source: Public Records
Tax History
| Year | Tax Paid | Tax Assessment Tax Assessment Total Assessment is a certain percentage of the fair market value that is determined by local assessors to be the total taxable value of land and additions on the property. | Land | Improvement |
|---|---|---|---|---|
| 2024 | $4,781 | $73,213 | $11,323 | $61,890 |
| 2022 | $4,781 | $59,225 | $9,160 | $50,065 |
| 2021 | $4,587 | $55,878 | $8,642 | $47,236 |
| 2020 | $4,556 | $55,297 | $8,552 | $46,745 |
| 2019 | $4,399 | $55,000 | $8,506 | $46,494 |
| 2018 | $4,344 | $54,418 | $8,416 | $46,002 |
| 2017 | $4,190 | $54,418 | $8,416 | $46,002 |
| 2016 | $4,144 | $54,418 | $8,416 | $46,002 |
| 2015 | $4,020 | $53,143 | $8,219 | $44,924 |
| 2014 | $3,970 | $53,143 | $8,219 | $44,924 |
| 2013 | -- | $53,143 | $8,219 | $44,924 |
Source: Public Records
Map
Nearby Homes
- 3001 E Raab Rd
- 2884 Three Eagles St
- 2968 Wolf Creek Ln
- 1170 Lynx Ln
- Town ship 24 North SE (1 4) of Section 19
- Lot G Corner Fort Jesse & Towanda Barnes
- Lot H Towanda Barnes
- 2625 Shale Rd
- 2618 Limestone Ct
- Lot 8 Jehova
- 3225 Marimarsh Ln
- 2608 Shale Rd
- 2602 Marble Rd
- 1236 Blue Bill Way
- 1211 Travertine Rd
- 2538 Marble Rd
- 1192 Blue Bill Way
- 1214 Slate St
- 3551 Napa Ln
- 2501 Fieldstone Ct
- 3015 E Raab Rd
- 2995 E Raab Rd
- 2991 E Raab Rd
- 3020 Bear Claw St
- 3012 Bear Claw St
- 2985 E Raab Rd
- 1298 North Pointe Dr
- 3000 Bear Claw St
- 2981 E Raab Rd
- 1290 N Pointe Dr
- 1298 N Pointe Dr
- 1290 North Pointe Dr
- 2984 Bear Claw St
- 2975 E Raab Rd
- 1278 N Pointe Dr
- 1278 North Pointe Dr
- 2971 E Raab Rd
- 2972 Bear Claw St
- 1266 N Pointe Dr
- 1266 North Pointe Dr
Your Personal Tour Guide
Ask me questions while you tour the home.