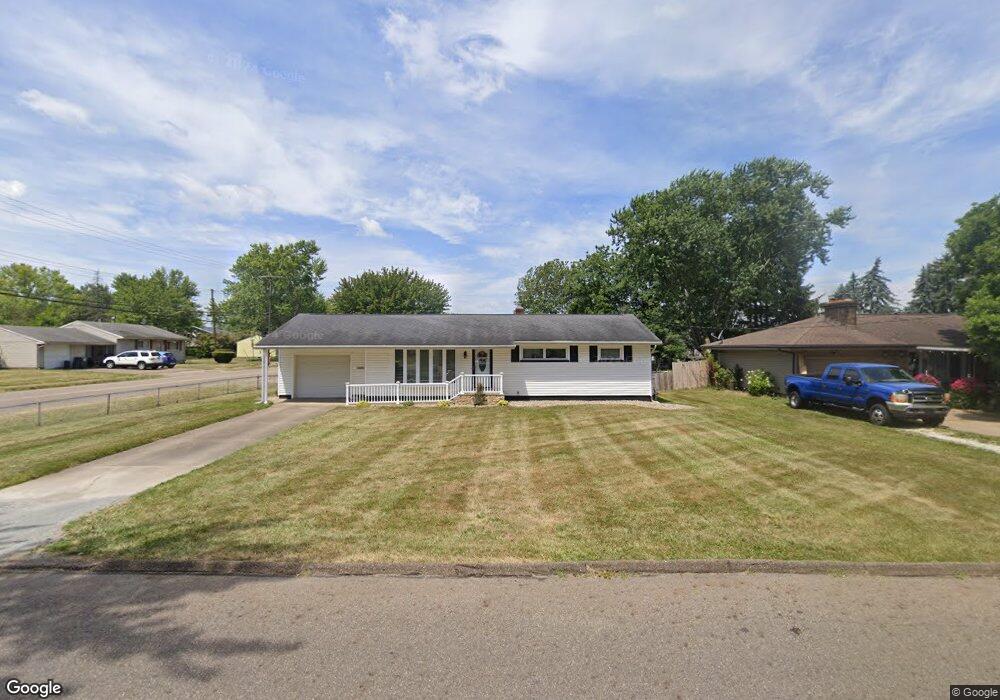
3005 Endrow Ave NE Canton, OH 44705
Fairmount NeighborhoodEstimated Value: $147,000 - $192,000
3
Beds
2
Baths
1,144
Sq Ft
$148/Sq Ft
Est. Value
About This Home
This home is located at 3005 Endrow Ave NE, Canton, OH 44705 and is currently estimated at $168,902, approximately $147 per square foot. 3005 Endrow Ave NE is a home located in Stark County with nearby schools including Ransom H. Barr Elementary School, Glenwood Intermediate School, and GlenOak High School.
Ownership History
Date
Name
Owned For
Owner Type
Purchase Details
Closed on
Dec 28, 2009
Sold by
Lasalle Bank National Association
Bought by
Sanders Ozell
Current Estimated Value
Home Financials for this Owner
Home Financials are based on the most recent Mortgage that was taken out on this home.
Original Mortgage
$58,913
Outstanding Balance
$38,426
Interest Rate
4.9%
Mortgage Type
FHA
Estimated Equity
$130,476
Purchase Details
Closed on
Oct 6, 2008
Sold by
Kelley Mary Jane
Bought by
Lasalle Bank National Association and Lasalle National Bank
Purchase Details
Closed on
Nov 17, 1999
Sold by
Fladung Lucille C
Bought by
Kelley Mary Jane
Home Financials for this Owner
Home Financials are based on the most recent Mortgage that was taken out on this home.
Original Mortgage
$54,000
Interest Rate
12.87%
Mortgage Type
Purchase Money Mortgage
Create a Home Valuation Report for This Property
The Home Valuation Report is an in-depth analysis detailing your home's value as well as a comparison with similar homes in the area
Home Values in the Area
Average Home Value in this Area
Purchase History
| Date | Buyer | Sale Price | Title Company |
|---|---|---|---|
| Sanders Ozell | $60,000 | Attorney | |
| Lasalle Bank National Association | $60,000 | None Available | |
| Kelley Mary Jane | $72,000 | -- |
Source: Public Records
Mortgage History
| Date | Status | Borrower | Loan Amount |
|---|---|---|---|
| Open | Sanders Ozell | $58,913 | |
| Previous Owner | Kelley Mary Jane | $54,000 | |
| Closed | Kelley Mary Jane | $15,000 |
Source: Public Records
Tax History Compared to Growth
Tax History
| Year | Tax Paid | Tax Assessment Tax Assessment Total Assessment is a certain percentage of the fair market value that is determined by local assessors to be the total taxable value of land and additions on the property. | Land | Improvement |
|---|---|---|---|---|
| 2025 | -- | $63,350 | $16,800 | $46,550 |
| 2024 | -- | $63,350 | $16,800 | $46,550 |
| 2023 | $1,874 | $36,230 | $8,540 | $27,690 |
| 2022 | $1,765 | $36,230 | $8,540 | $27,690 |
| 2021 | $2,128 | $36,230 | $8,540 | $27,690 |
| 2020 | $1,591 | $29,370 | $7,390 | $21,980 |
| 2019 | $2,236 | $29,370 | $7,390 | $21,980 |
| 2018 | $1,869 | $29,370 | $7,390 | $21,980 |
| 2017 | $1,841 | $26,570 | $7,460 | $19,110 |
| 2016 | $1,733 | $26,570 | $7,460 | $19,110 |
| 2015 | $934 | $26,570 | $7,460 | $19,110 |
| 2014 | $1,467 | $26,820 | $7,530 | $19,290 |
| 2013 | $717 | $26,820 | $7,530 | $19,290 |
Source: Public Records
Map
Nearby Homes
- 3015 Bollinger Ave NE
- 3023 Bollinger Ave NE
- 2827 Daleford Ave NE
- 3504 Fairmount Blvd NE
- 3305 Regent Ave NE
- 2941 Fletcher Ave NE
- 2602 Baldwin Ave NE
- 2310 Willowrow Ave NE
- 2940 Ellis Ave NE
- 3022 Taft Ave NE
- 2319 Daleford Ave NE
- 2409 Gilbert Ave NE
- 2715 19th St NE
- 2314 24th St NE
- 3730 Kirby Ave NE
- 1821 Wallace Ave NE
- 2017 28th St NE
- 4123 Regentview St NE
- 1710 Harmont Ave NE
- 2220 Harrisburg Rd NE
- 3013 Endrow Ave NE
- 3023 30th St NE
- 3030 30th St NE
- 3038 30th St NE
- 3019 Endrow Ave NE
- 3044 30th St NE
- 3100 30th St NE
- 3027 Endrow Ave NE
- 2986 Sahara Ave NE
- 3021 30th St NE
- 3002 Endrow Ave NE
- 3008 Endrow Ave NE
- 3014 30th St NE
- 3018 Brush Place NE
- 3012 Endrow Ave NE
- 3104 30th St NE
- 3015 30th St NE
- 2985 Sahara Ave NE
- 3014 Brush Place NE
- 2991 Sahara Ave NE