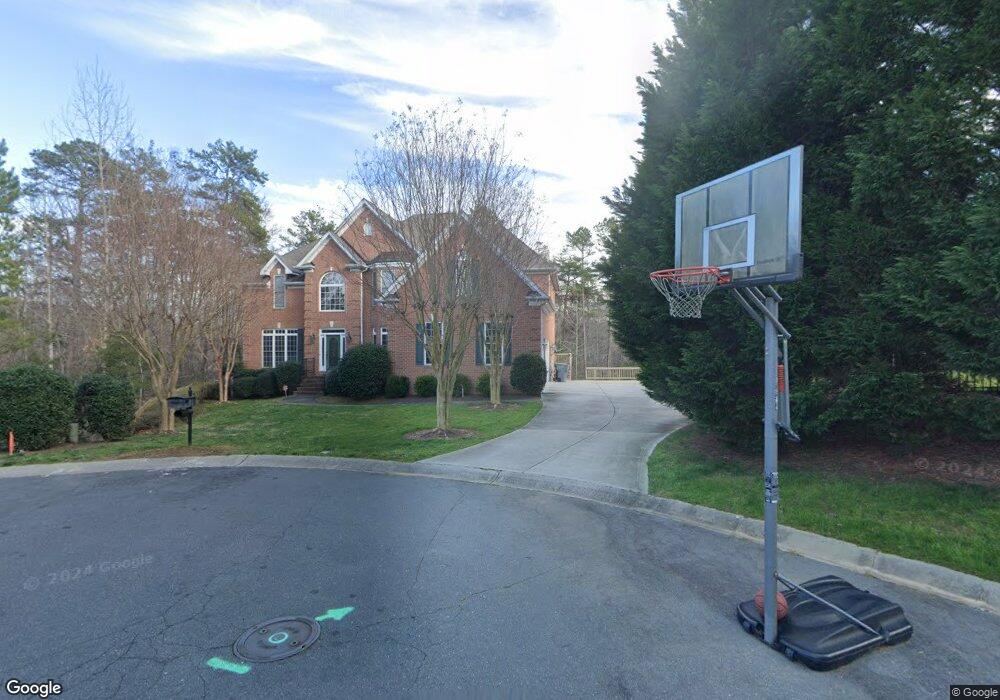
3005 Field Maple Ln Charlotte, NC 28270
Providence NeighborhoodEstimated Value: $1,386,000 - $1,689,000
6
Beds
7
Baths
5,879
Sq Ft
$257/Sq Ft
Est. Value
About This Home
This home is located at 3005 Field Maple Ln, Charlotte, NC 28270 and is currently estimated at $1,511,831, approximately $257 per square foot. 3005 Field Maple Ln is a home located in Mecklenburg County with nearby schools including Providence Spring Elementary, Crestdale Middle School, and Providence High.
Ownership History
Date
Name
Owned For
Owner Type
Purchase Details
Closed on
Aug 30, 2013
Sold by
Richardson Brian F and Richardson Lanae C
Bought by
Stanley Eric and Stanley Debby
Current Estimated Value
Home Financials for this Owner
Home Financials are based on the most recent Mortgage that was taken out on this home.
Original Mortgage
$559,200
Outstanding Balance
$397,583
Interest Rate
3.25%
Mortgage Type
Adjustable Rate Mortgage/ARM
Estimated Equity
$1,114,248
Purchase Details
Closed on
Dec 9, 2011
Sold by
Loven James and Loven Pamela
Bought by
Richardson Brian F and Richardson Lanae C
Home Financials for this Owner
Home Financials are based on the most recent Mortgage that was taken out on this home.
Original Mortgage
$693,500
Interest Rate
4.15%
Mortgage Type
New Conventional
Purchase Details
Closed on
Dec 12, 2000
Sold by
Craft Homes Usa Llc
Bought by
Loven James and Loven Pamela A
Create a Home Valuation Report for This Property
The Home Valuation Report is an in-depth analysis detailing your home's value as well as a comparison with similar homes in the area
Home Values in the Area
Average Home Value in this Area
Purchase History
| Date | Buyer | Sale Price | Title Company |
|---|---|---|---|
| Stanley Eric | $699,000 | None Available | |
| Richardson Brian F | $730,000 | None Available | |
| Loven James | $522,000 | -- |
Source: Public Records
Mortgage History
| Date | Status | Borrower | Loan Amount |
|---|---|---|---|
| Open | Stanley Eric | $559,200 | |
| Previous Owner | Richardson Brian F | $693,500 |
Source: Public Records
Tax History Compared to Growth
Tax History
| Year | Tax Paid | Tax Assessment Tax Assessment Total Assessment is a certain percentage of the fair market value that is determined by local assessors to be the total taxable value of land and additions on the property. | Land | Improvement |
|---|---|---|---|---|
| 2025 | $8,620 | $1,118,100 | $262,500 | $855,600 |
| 2024 | $8,620 | $1,118,100 | $262,500 | $855,600 |
| 2023 | $8,340 | $1,118,100 | $262,500 | $855,600 |
| 2022 | $7,284 | $741,800 | $166,500 | $575,300 |
| 2021 | $7,273 | $741,800 | $166,500 | $575,300 |
| 2020 | $7,266 | $741,800 | $166,500 | $575,300 |
| 2019 | $7,250 | $741,800 | $166,500 | $575,300 |
| 2018 | $7,672 | $579,200 | $72,000 | $507,200 |
| 2017 | $7,560 | $579,200 | $72,000 | $507,200 |
| 2016 | $7,551 | $579,200 | $72,000 | $507,200 |
| 2015 | $7,539 | $563,500 | $72,000 | $491,500 |
| 2014 | $8,124 | $633,000 | $90,000 | $543,000 |
Source: Public Records
Map
Nearby Homes
- 3021 Poplar Hill Rd
- 2723 Providence Pine Ln
- 3710 Cheleys Ridge Ln
- 2836 Providence Spring Ln
- 2533 Grimmersborough Ln
- 2624 Brook Hollow Rd
- 3216 High Ridge Rd
- 2638 High Ridge Rd
- 3113 Plantation Rd
- 2500 High Ridge Rd
- 5016 Celeste Ct
- 5500 Flowering Dogwood Ln
- 3306 Nancy Creek Rd
- 2007 Maynard Rd
- 3327 Lakeside Dr
- 6800 Augustine Way
- 6700 Augustine Way
- 1837 Kilmonack Ln
- 914 Mangionne Dr
- 2919 Redfield Dr
- 3004 Field Maple Ln
- 3002 Sessile Oak Ln
- 2825 Providence View Ln
- 2825 Providence View Ln Unit 46
- 2811 Providence View Ln
- 2833 Providence View Ln
- 2805 Providence View Ln
- 2341 Providence Creek Ln
- 3003 Sessile Oak Ln
- 2901 Providence View Ln
- 3017 Poplar Hill Rd
- 2800 Providence View Ln
- 2337 Providence Creek Ln
- 2727 Providence Pine Ln
- 2820 Providence View Ln
- 2812 Providence View Ln
- 2828 Providence View Ln
- 2338 Providence Creek Ln
- 2909 Providence View Ln
- 3020 Poplar Hill Rd