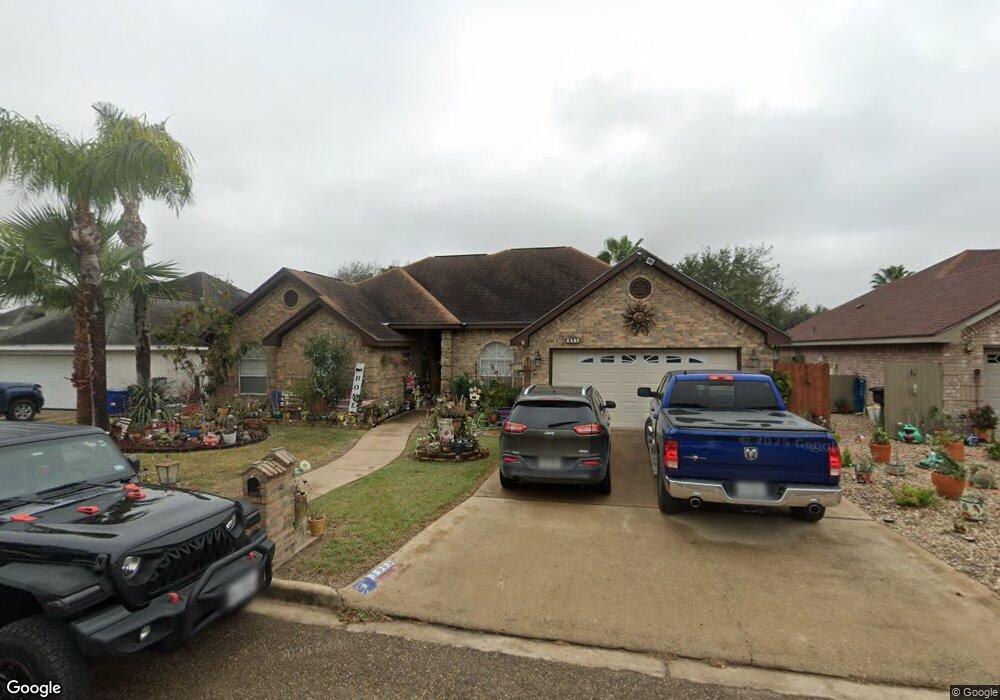
3005 Flamingo Ave McAllen, TX 78504
Estimated Value: $256,858 - $295,000
3
Beds
2
Baths
1,864
Sq Ft
$145/Sq Ft
Est. Value
About This Home
This home is located at 3005 Flamingo Ave, McAllen, TX 78504 and is currently estimated at $270,965, approximately $145 per square foot. 3005 Flamingo Ave is a home located in Hidalgo County with nearby schools including Garza Elementary School, Michael E. Fossum Middle School, and Rowe High School.
Ownership History
Date
Name
Owned For
Owner Type
Purchase Details
Closed on
Feb 16, 2019
Sold by
Pelshaw Gregory A
Bought by
Pelshaw Apryle A
Current Estimated Value
Home Financials for this Owner
Home Financials are based on the most recent Mortgage that was taken out on this home.
Original Mortgage
$86,543
Outstanding Balance
$55,426
Interest Rate
4.4%
Mortgage Type
New Conventional
Estimated Equity
$215,539
Purchase Details
Closed on
Aug 17, 2010
Sold by
Guzman Nesim E and Guzman Silvia C
Bought by
Pelshaw Gregory A and Pelshaw Apryle A
Home Financials for this Owner
Home Financials are based on the most recent Mortgage that was taken out on this home.
Original Mortgage
$127,285
Interest Rate
5.5%
Mortgage Type
FHA
Purchase Details
Closed on
May 11, 1998
Sold by
Thomas Bruce Marsha Thomas
Bought by
Ortega Rene and Ortega Elizabeth M
Home Financials for this Owner
Home Financials are based on the most recent Mortgage that was taken out on this home.
Original Mortgage
$89,550
Interest Rate
7.13%
Create a Home Valuation Report for This Property
The Home Valuation Report is an in-depth analysis detailing your home's value as well as a comparison with similar homes in the area
Home Values in the Area
Average Home Value in this Area
Purchase History
| Date | Buyer | Sale Price | Title Company |
|---|---|---|---|
| Pelshaw Apryle A | -- | None Available | |
| Pelshaw Gregory A | -- | San Jacinto Title Services M | |
| Ortega Rene | -- | Stewart Title |
Source: Public Records
Mortgage History
| Date | Status | Borrower | Loan Amount |
|---|---|---|---|
| Open | Pelshaw Apryle A | $86,543 | |
| Closed | Pelshaw Gregory A | $127,285 | |
| Previous Owner | Ortega Rene | $89,550 |
Source: Public Records
Tax History Compared to Growth
Tax History
| Year | Tax Paid | Tax Assessment Tax Assessment Total Assessment is a certain percentage of the fair market value that is determined by local assessors to be the total taxable value of land and additions on the property. | Land | Improvement |
|---|---|---|---|---|
| 2025 | $4,164 | $206,089 | $41,650 | $164,439 |
| 2024 | $4,164 | $220,172 | -- | -- |
| 2023 | $4,709 | $200,156 | $0 | $0 |
| 2022 | $4,512 | $181,960 | $0 | $0 |
| 2021 | $4,226 | $165,418 | $41,650 | $147,730 |
| 2020 | $3,836 | $150,380 | $41,650 | $108,730 |
| 2019 | $3,853 | $151,916 | $41,650 | $110,266 |
| 2018 | $3,617 | $142,379 | $29,400 | $112,979 |
| 2017 | $3,666 | $143,734 | $29,400 | $114,334 |
| 2016 | $3,701 | $145,088 | $29,400 | $115,688 |
| 2015 | $3,154 | $142,954 | $28,000 | $125,530 |
Source: Public Records
Map
Nearby Homes
- 2801 Hawk Ave
- 5417 N 31st St
- 5405 N 28th St
- 5604 N 34th St
- 3021 Hummingbird Ave
- 2712 Bluebird Ave
- 5800 N 26th St
- 4217 Hummingbird Ave
- 4204 Hummingbird Ave
- 4200 Hummingbird Ave
- 5509 N 35th St
- 6012 N 26th St
- 2521 Gull Ave
- 3501 Bluebird Ave
- 6208 N 29th Ln
- 5219 N 25th Ln
- 4201 Heron Ave
- 4308 Heron Ave
- 11308 N 25th St
- 9227 N 25th St
- 3001 Flamingo Ave
- 3009 Flamingo Ave
- 3004 Falcon Ave
- 3013 Flamingo Ave
- 3000 Falcon Ave
- 5809 N 29th Ln
- 3004 Flamingo Ave
- 3008 Flamingo Ave
- 3000 Flamingo Ave
- 3000 Flamingo Ave
- 5805 N 29th Ln
- 3008 Falcon Ave
- 3012 Falcon Ave
- 3012 Flamingo Ave
- 3101 Flamingo Ave
- 2912 Flamingo Ave
- 3001 Falcon Ave
- 3100 Falcon Ave
- 5801 N 29th Ln
- 3005 Goldcrest Ave