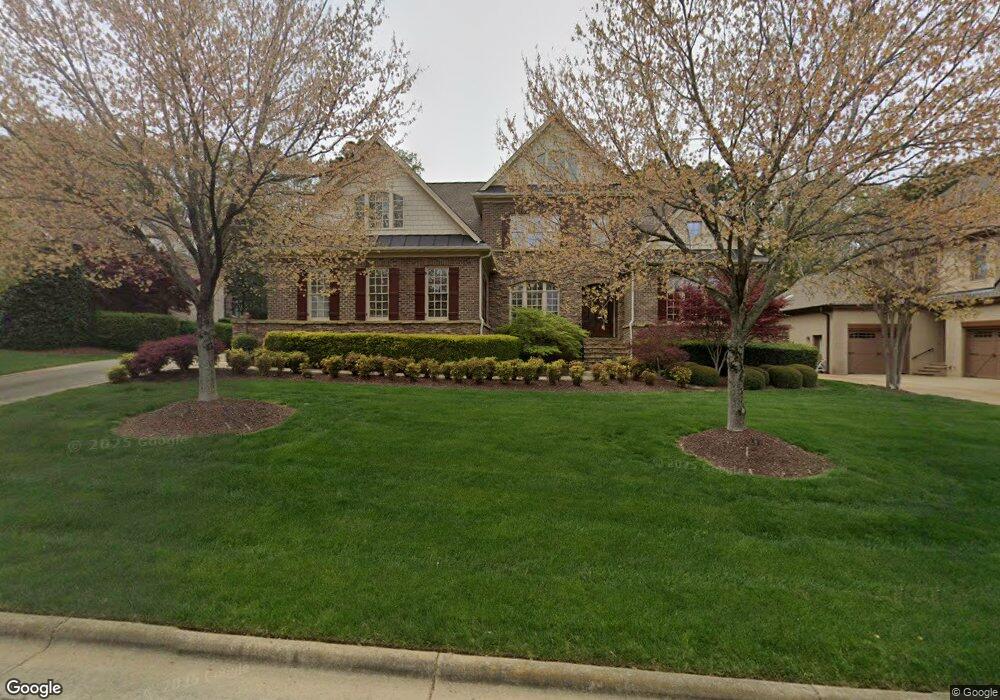
3005 Greyhawk Place Unit Lot 9 Apex, NC 27539
Middle Creek NeighborhoodEstimated Value: $1,488,453 - $1,686,000
4
Beds
4
Baths
4,814
Sq Ft
$330/Sq Ft
Est. Value
About This Home
This home is located at 3005 Greyhawk Place Unit Lot 9, Apex, NC 27539 and is currently estimated at $1,587,613, approximately $329 per square foot. 3005 Greyhawk Place Unit Lot 9 is a home located in Wake County with nearby schools including Penny Road Elementary School, Dillard Drive Magnet Middle School, and Middle Creek High.
Ownership History
Date
Name
Owned For
Owner Type
Purchase Details
Closed on
Jan 21, 2016
Sold by
Riefenhauser Peter A and Reifenhauser Debra
Bought by
Dao Gia Phu and Dao Lisa
Current Estimated Value
Home Financials for this Owner
Home Financials are based on the most recent Mortgage that was taken out on this home.
Original Mortgage
$740,000
Outstanding Balance
$589,115
Interest Rate
3.99%
Mortgage Type
New Conventional
Estimated Equity
$998,498
Purchase Details
Closed on
Jul 29, 2010
Sold by
Baron Custom Homes Inc
Bought by
Riefenhauser Peter A and Riefenhauser Debra
Home Financials for this Owner
Home Financials are based on the most recent Mortgage that was taken out on this home.
Original Mortgage
$275,000
Interest Rate
4.74%
Mortgage Type
New Conventional
Purchase Details
Closed on
Apr 28, 2006
Sold by
Greyhawk Llc
Bought by
Baron Custom Homes Inc
Create a Home Valuation Report for This Property
The Home Valuation Report is an in-depth analysis detailing your home's value as well as a comparison with similar homes in the area
Home Values in the Area
Average Home Value in this Area
Purchase History
| Date | Buyer | Sale Price | Title Company |
|---|---|---|---|
| Dao Gia Phu | $925,000 | None Available | |
| Riefenhauser Peter A | $950,000 | None Available | |
| Baron Custom Homes Inc | $1,159,000 | None Available |
Source: Public Records
Mortgage History
| Date | Status | Borrower | Loan Amount |
|---|---|---|---|
| Open | Dao Gia Phu | $740,000 | |
| Previous Owner | Riefenhauser Peter A | $275,000 |
Source: Public Records
Tax History Compared to Growth
Tax History
| Year | Tax Paid | Tax Assessment Tax Assessment Total Assessment is a certain percentage of the fair market value that is determined by local assessors to be the total taxable value of land and additions on the property. | Land | Improvement |
|---|---|---|---|---|
| 2025 | $11,882 | $1,383,941 | $250,000 | $1,133,941 |
| 2024 | $11,624 | $1,383,941 | $250,000 | $1,133,941 |
| 2023 | $9,636 | $959,679 | $150,000 | $809,679 |
| 2022 | $9,276 | $959,679 | $150,000 | $809,679 |
| 2021 | $9,089 | $959,679 | $150,000 | $809,679 |
| 2020 | $9,137 | $959,679 | $150,000 | $809,679 |
| 2019 | $9,535 | $888,699 | $168,000 | $720,699 |
| 2018 | $8,946 | $888,699 | $168,000 | $720,699 |
| 2017 | $8,596 | $888,699 | $168,000 | $720,699 |
| 2016 | $8,467 | $888,699 | $168,000 | $720,699 |
| 2015 | $9,291 | $941,675 | $178,000 | $763,675 |
| 2014 | -- | $941,675 | $178,000 | $763,675 |
Source: Public Records
Map
Nearby Homes
- 612 Hawks Ridge Ct
- 4104 Green Chase Way
- 1108 Bradshaw Ct
- 5308 Amsterdam Place
- 112 Sonoma Valley Dr
- 116 Vintage Hill Cir
- 1029 Dozier Way
- 4104 Belnap Dr
- 4028 Franks Creek Dr Unit Lot 44
- 3208 Treewood Ln
- 207 Forest Run Place
- 102 Travilah Oaks Ln
- 103 Moss Rose Ct
- 105 Aspen Hollow Ct
- 102 Serence Ct
- 1023 Augustine Trail
- 203 Piperwood Dr
- 4425 Surry Ridge Cir
- 3417 Birk Bluff Ct
- 222 Shillings Chase Dr
- 3005 Greyhawk Place
- 3007 Grey Hawk Place Unit Lot10
- 3007 Greyhawk Place
- 3003 Greyhawk Place
- 3003 Greyhawk Place Unit Lot 8
- 3001 Greyhawk Place
- 3001 Greyhawk Place Unit Lot 7
- 5505 Den Heider Way
- 0 Greyhawk Place Unit 1767936
- 0 Greyhawk Place Unit 1767941
- 0 Greyhawk Place Unit 52 TR1767936
- 0 Greyhawk Place Unit 13 TR1767941
- 3006 Greyhawk Place
- 3006 Greyhawk Place Unit Lot58
- 3006 Grey Hawk Place Unit Lot58
- 4001 Greyhawk Place
- 4001 Greyhawk Place Unit Lot11
- 3004 Greyhawk Place
- 3004 Greyhawk Place Unit 57
- 2074 Van Gogh Ln