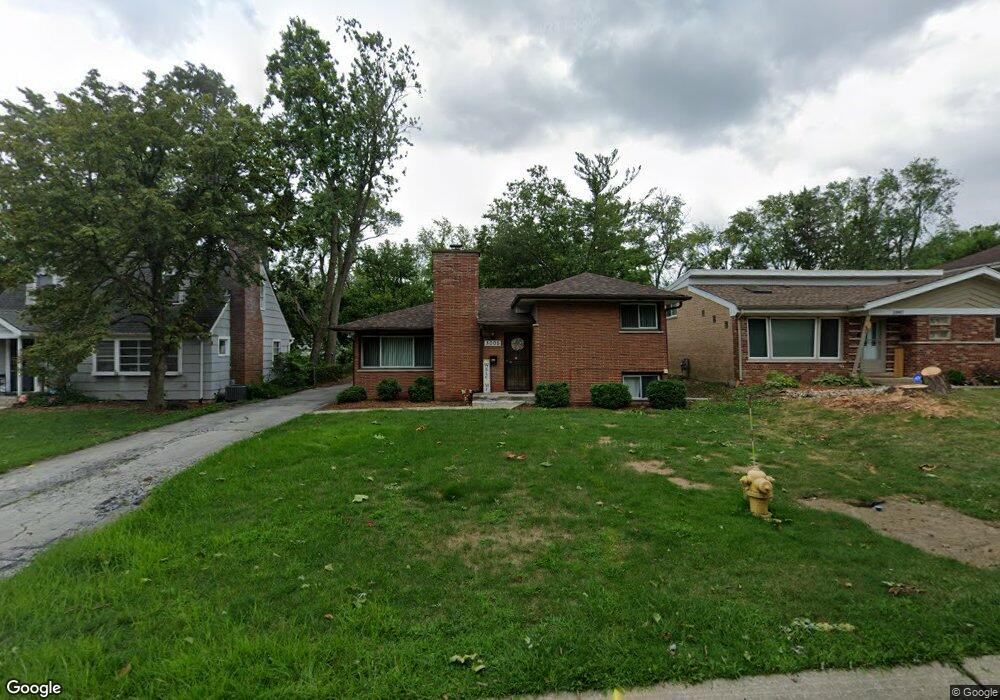
3005 Longfellow Ave Hazel Crest, IL 60429
Estimated Value: $193,755 - $262,000
4
Beds
2
Baths
1,620
Sq Ft
$138/Sq Ft
Est. Value
About This Home
This home is located at 3005 Longfellow Ave, Hazel Crest, IL 60429 and is currently estimated at $223,939, approximately $138 per square foot. 3005 Longfellow Ave is a home located in Cook County with nearby schools including Mae Jemison School, Prairie-Hills Junior High School, and Hillcrest High School.
Ownership History
Date
Name
Owned For
Owner Type
Purchase Details
Closed on
Jul 20, 2012
Sold by
Petrakh Nazariy
Bought by
Williams Latonya V
Current Estimated Value
Home Financials for this Owner
Home Financials are based on the most recent Mortgage that was taken out on this home.
Original Mortgage
$125,190
Outstanding Balance
$86,307
Interest Rate
3.87%
Mortgage Type
FHA
Estimated Equity
$137,632
Purchase Details
Closed on
Oct 26, 2011
Sold by
Secretary Of Housing & Urban Development
Bought by
Petrakh Nazariy
Purchase Details
Closed on
Apr 7, 2009
Sold by
Kent
Bought by
Secretary Of Housing & Urban Development
Purchase Details
Closed on
Jun 30, 1995
Sold by
Cox Randall C
Bought by
Kent Derrick B and Kent Nicole
Home Financials for this Owner
Home Financials are based on the most recent Mortgage that was taken out on this home.
Original Mortgage
$95,370
Interest Rate
7.59%
Mortgage Type
Assumption
Create a Home Valuation Report for This Property
The Home Valuation Report is an in-depth analysis detailing your home's value as well as a comparison with similar homes in the area
Home Values in the Area
Average Home Value in this Area
Purchase History
| Date | Buyer | Sale Price | Title Company |
|---|---|---|---|
| Williams Latonya V | $127,500 | Pntn | |
| Petrakh Nazariy | -- | Stewart Title Company | |
| Secretary Of Housing & Urban Development | -- | None Available | |
| Kent Derrick B | $93,500 | -- |
Source: Public Records
Mortgage History
| Date | Status | Borrower | Loan Amount |
|---|---|---|---|
| Open | Williams Latonya V | $125,190 | |
| Previous Owner | Kent Derrick B | $95,370 |
Source: Public Records
Tax History
| Year | Tax Paid | Tax Assessment Tax Assessment Total Assessment is a certain percentage of the fair market value that is determined by local assessors to be the total taxable value of land and additions on the property. | Land | Improvement |
|---|---|---|---|---|
| 2025 | $7,522 | $18,000 | $2,334 | $15,666 |
| 2024 | $7,522 | $18,000 | $2,334 | $15,666 |
| 2023 | $6,263 | $18,000 | $2,334 | $15,666 |
| 2022 | $6,263 | $11,951 | $1,975 | $9,976 |
| 2021 | $6,100 | $11,951 | $1,975 | $9,976 |
| 2020 | $5,944 | $11,951 | $1,975 | $9,976 |
| 2019 | $5,700 | $11,942 | $1,795 | $10,147 |
| 2018 | $5,519 | $11,942 | $1,795 | $10,147 |
| 2017 | $5,193 | $11,942 | $1,795 | $10,147 |
| 2016 | $5,476 | $11,864 | $1,615 | $10,249 |
| 2015 | $5,176 | $11,864 | $1,615 | $10,249 |
| 2014 | $5,078 | $11,864 | $1,615 | $10,249 |
| 2013 | $5,308 | $11,083 | $1,615 | $9,468 |
Source: Public Records
Map
Nearby Homes
- 3004 Longfellow Ave
- 3100 Longfellow Ave
- 17410 Emerson Ave
- 2904 Woodworth Place
- 3107 Longfellow Ave
- 3107 173rd St
- 2817 173rd St
- 2912 175th St
- 17405 Longfellow Ave
- 2900 175th St
- 3124 173rd St
- 17120 Whittier Ave
- 17417 Kedzie Ave
- 7 E Carriageway Dr Unit 311
- 5 E Carriageway Dr Unit 201
- 5 E Carriageway Dr Unit 210
- 3213 Woodworth Place
- 3012 171st St Unit GT
- 17107 California Ave
- 17006 Novak Dr Unit T107
- 3007 Longfellow Ave
- 3009 Longfellow Ave
- 3001 Longfellow Ave
- 17306 Holmes Ave
- 17304 Holmes Ave
- 3011 Longfellow Ave
- 3000 Longfellow Ave
- 17310 Holmes Ave
- 3013 Longfellow Ave
- 3002 Longfellow Ave
- 17312 Holmes Ave
- 17300 Longfellow Ave
- 3003 173rd St
- 17300 Holmes Ave
- 3015 Longfellow Ave
- 3015 Longfellow Ave
- 3005 173rd St
- 3006 Longfellow Ave
- 17316 Holmes Ave
- 17307 Holmes Ave
Your Personal Tour Guide
Ask me questions while you tour the home.