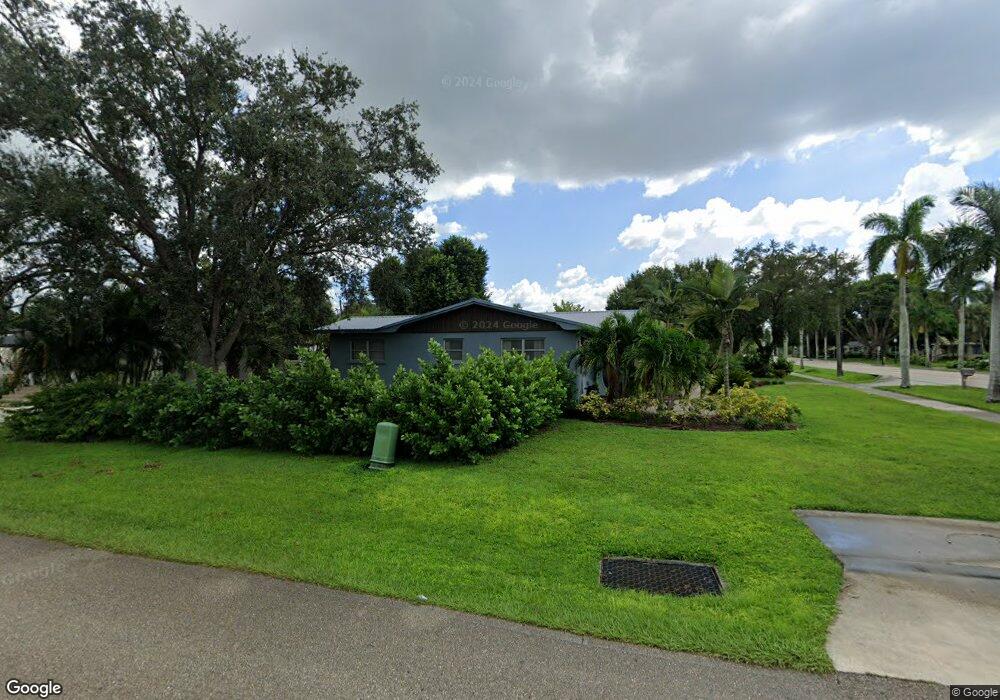
3005 Mcgregor Blvd Fort Myers, FL 33901
Coconut Grove NeighborhoodEstimated Value: $502,000 - $642,000
3
Beds
2
Baths
2,225
Sq Ft
$257/Sq Ft
Est. Value
About This Home
This home is located at 3005 Mcgregor Blvd, Fort Myers, FL 33901 and is currently estimated at $572,441, approximately $257 per square foot. 3005 Mcgregor Blvd is a home located in Lee County with nearby schools including Allen Park Elementary School, Edison Park Creative & Expressive Arts School, and Orangewood Elementary School.
Ownership History
Date
Name
Owned For
Owner Type
Purchase Details
Closed on
May 8, 2013
Sold by
Jenw Investments Llc
Bought by
Lindsey Dustin B and Lindsey Jessica M
Current Estimated Value
Home Financials for this Owner
Home Financials are based on the most recent Mortgage that was taken out on this home.
Original Mortgage
$181,390
Outstanding Balance
$128,303
Interest Rate
3.44%
Mortgage Type
New Conventional
Estimated Equity
$444,138
Purchase Details
Closed on
Feb 1, 2013
Sold by
Chang Jacqueline
Bought by
Jenw Investments Llc
Purchase Details
Closed on
Apr 9, 2012
Sold by
2 Chows Investments Llc
Bought by
Chang Jacqueline
Purchase Details
Closed on
Sep 2, 2011
Sold by
Suncoast Partners Inc
Bought by
2 Chows Investments Llc and Jenw Investments Llc
Purchase Details
Closed on
Aug 30, 2011
Sold by
Parker Cynthia F
Bought by
Suncoast Partners Inc
Purchase Details
Closed on
Mar 22, 2000
Sold by
Acree Oruy Osborne
Bought by
Dunnington Amy L
Create a Home Valuation Report for This Property
The Home Valuation Report is an in-depth analysis detailing your home's value as well as a comparison with similar homes in the area
Home Values in the Area
Average Home Value in this Area
Purchase History
| Date | Buyer | Sale Price | Title Company |
|---|---|---|---|
| Lindsey Dustin B | $187,000 | Gulfstream Title Llc | |
| Jenw Investments Llc | -- | None Available | |
| Chang Jacqueline | -- | Attorney | |
| 2 Chows Investments Llc | -- | None Available | |
| Suncoast Partners Inc | $85,100 | None Available | |
| Dunnington Amy L | -- | -- |
Source: Public Records
Mortgage History
| Date | Status | Borrower | Loan Amount |
|---|---|---|---|
| Open | Lindsey Dustin B | $181,390 |
Source: Public Records
Tax History Compared to Growth
Tax History
| Year | Tax Paid | Tax Assessment Tax Assessment Total Assessment is a certain percentage of the fair market value that is determined by local assessors to be the total taxable value of land and additions on the property. | Land | Improvement |
|---|---|---|---|---|
| 2025 | $4,883 | $302,071 | -- | -- |
| 2024 | $4,792 | $293,558 | -- | -- |
| 2023 | $4,792 | $285,008 | $0 | $0 |
| 2022 | $4,765 | $276,707 | $0 | $0 |
| 2021 | $4,839 | $287,551 | $81,910 | $205,641 |
| 2020 | $4,806 | $264,047 | $73,250 | $190,797 |
| 2019 | $4,656 | $233,363 | $73,250 | $160,113 |
| 2018 | $4,488 | $233,372 | $73,250 | $160,122 |
| 2017 | $4,360 | $235,799 | $58,000 | $177,799 |
| 2016 | $3,875 | $188,797 | $60,500 | $128,297 |
| 2015 | $3,369 | $137,099 | $46,787 | $90,312 |
| 2014 | $3,346 | $139,502 | $46,835 | $92,667 |
| 2013 | -- | $101,604 | $24,146 | $77,458 |
Source: Public Records
Map
Nearby Homes
- 1377 Coconut Dr
- 1342 Alhambra Dr
- 2943 Valencia Way
- 2904 Valencia Way
- 1556 Barcelona Ave
- 1478 Cordova Ave
- 2979 Cortez Blvd
- 2812 Mcgregor Blvd
- 1223 Coconut Dr
- 1204 Alhambra Dr Unit 55
- 1204 Alhambra Dr
- 1209 Coconut Dr
- 1212 Coconut Dr
- 2932 Holly Rd
- 3235 Avocado Dr
- 1531 Grace Ave
- 2963 Holly Rd
- 1561 Lynwood Ave
- 1301 Poinciana Ave
- 1551 Passaic Ave
- 1414 Alhambra Dr
- 1424 Alhambra Dr
- 3004 Mcgregor Blvd
- 3010 Mcgregor Blvd
- 2995 Mcgregor Blvd
- 1431 Coconut Dr
- 1434 Alhambra Dr Unit 210
- 1375 Alhambra Dr
- 1425 Alhambra Dr
- 1360 Alhambra Dr
- 2962 Mcgregor Blvd
- 2985 Mcgregor Blvd
- 1442 Alhambra Dr
- 1439 Coconut Dr
- 1361 Coconut Dr
- 1357 Alhambra Dr
- 1348 Alhambra Dr
- 1443 Alhambra Dr
- 2950 Mcgregor Blvd