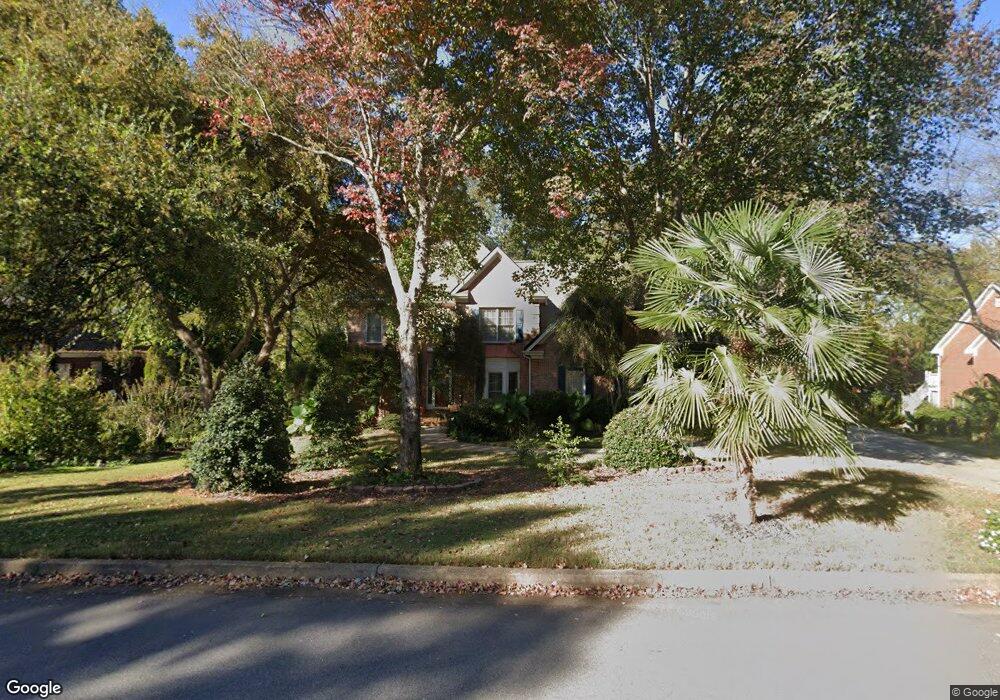
3005 Sexton Ct Unit 4 Conyers, GA 30013
Estimated Value: $446,959 - $603,000
4
Beds
6
Baths
3,103
Sq Ft
$158/Sq Ft
Est. Value
About This Home
This home is located at 3005 Sexton Ct Unit 4, Conyers, GA 30013 and is currently estimated at $490,490, approximately $158 per square foot. 3005 Sexton Ct Unit 4 is a home located in Rockdale County with nearby schools including Flat Shoals Elementary School, Memorial Middle School, and Salem High School.
Ownership History
Date
Name
Owned For
Owner Type
Purchase Details
Closed on
Sep 23, 2005
Sold by
Owens Terry A
Bought by
Bell Carl
Current Estimated Value
Home Financials for this Owner
Home Financials are based on the most recent Mortgage that was taken out on this home.
Original Mortgage
$244,000
Outstanding Balance
$133,804
Interest Rate
6.25%
Mortgage Type
New Conventional
Estimated Equity
$356,686
Purchase Details
Closed on
May 25, 2001
Sold by
Domanski Robert S and Domanski Elizabeth S
Bought by
Owen Terry A
Home Financials for this Owner
Home Financials are based on the most recent Mortgage that was taken out on this home.
Original Mortgage
$247,200
Interest Rate
7.11%
Mortgage Type
New Conventional
Purchase Details
Closed on
Oct 2, 1997
Sold by
The Waterford Development Group
Bought by
Domanski Robert S and Domanski Elizabeth
Home Financials for this Owner
Home Financials are based on the most recent Mortgage that was taken out on this home.
Original Mortgage
$240,000
Interest Rate
7.6%
Mortgage Type
New Conventional
Create a Home Valuation Report for This Property
The Home Valuation Report is an in-depth analysis detailing your home's value as well as a comparison with similar homes in the area
Home Values in the Area
Average Home Value in this Area
Purchase History
| Date | Buyer | Sale Price | Title Company |
|---|---|---|---|
| Bell Carl | $305,000 | -- | |
| Owen Terry A | $309,000 | -- | |
| Domanski Robert S | $300,000 | -- |
Source: Public Records
Mortgage History
| Date | Status | Borrower | Loan Amount |
|---|---|---|---|
| Open | Bell Carl | $244,000 | |
| Previous Owner | Owen Terry A | $247,200 | |
| Previous Owner | Domanski Robert S | $240,000 |
Source: Public Records
Tax History Compared to Growth
Tax History
| Year | Tax Paid | Tax Assessment Tax Assessment Total Assessment is a certain percentage of the fair market value that is determined by local assessors to be the total taxable value of land and additions on the property. | Land | Improvement |
|---|---|---|---|---|
| 2024 | $4,762 | $189,080 | $37,800 | $151,280 |
| 2023 | $3,915 | $162,240 | $34,920 | $127,320 |
| 2022 | $3,738 | $155,360 | $34,920 | $120,440 |
| 2021 | $3,240 | $127,440 | $24,080 | $103,360 |
| 2020 | $3,295 | $124,120 | $24,560 | $99,560 |
| 2019 | $2,791 | $105,080 | $15,000 | $90,080 |
| 2018 | $2,809 | $105,080 | $15,000 | $90,080 |
| 2017 | $2,732 | $101,400 | $15,000 | $86,400 |
| 2016 | $2,173 | $89,320 | $15,880 | $73,440 |
| 2015 | $2,177 | $89,320 | $15,880 | $73,440 |
| 2014 | $1,839 | $85,240 | $13,400 | $71,840 |
| 2013 | -- | $107,280 | $24,000 | $83,280 |
Source: Public Records
Map
Nearby Homes
- 1260 Sweet Shrub Ln SE
- 2561 Old Salem Cir SE
- 2791 Wellington Way SE Unit 1
- 1180 Azalea Cir SE
- 2684 Harvest Dr SE
- 1135 Vineyard Dr SE
- 2754 Harvest Dr SE
- 2474 Harvest Dr SE
- 2405 Old Salem Rd SE Unit 1
- 2052 Evergreen Dr SE
- 3095 Brombley Dr SE
- 1613 Brolington Ct
- 1115 Fountain Crest Dr
- 1613 Brentwood Crossing SE Unit 3
- 1388 Fall River Dr
- 2365 Brentmoore Point Unit 3
- 2259 Old Salem Rd SE
- 0 Sexton Ct Unit 8599276
- 0 Sexton Ct Unit 8491007
- 0 Sexton Ct Unit 8070160
- 0 Sexton Ct Unit 8029340
- 0 Sexton Ct Unit 3162202
- 0 Sexton Ct Unit 8464979
- 0 Sexton Ct
- 3003 Sexton Ct Unit 4
- 3007 Sexton Ct
- 1240 Oxford Dr SE
- 1230 Oxford Dr SE Unit 14
- 1230 Oxford Dr SE
- 3004 Sexton Ct Unit 4
- 3002 Sexton Ct Unit 4
- 1220 Oxford Dr SE
- 3009 Sexton Ct
- 3001 Sexton Ct
- 1250 Oxford Dr SE Unit 2
- 3006 Sexton Ct
- 3000 Sexton Ct