Estimated Value: $446,000 - $500,000
4
Beds
3
Baths
2,404
Sq Ft
$197/Sq Ft
Est. Value
About This Home
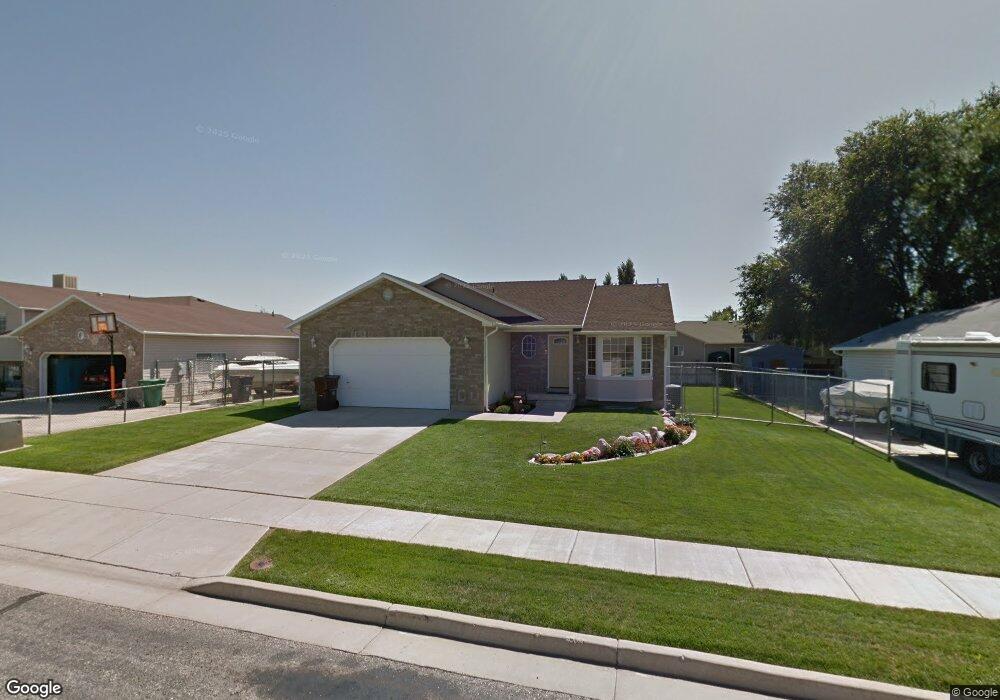
This home is located at 3005 W 4450 S, Roy, UT 84067 and is currently estimated at $473,817, approximately $197 per square foot. 3005 W 4450 S is a home located in Weber County with nearby schools including Midland School, Sand Ridge Junior High School, and Roy High School.
Ownership History
Date
Name
Owned For
Owner Type
Purchase Details
Closed on
Dec 20, 2019
Sold by
Creamer Cristie Lynn and The Cristie Lynn Creamer Livin
Bought by
Munk Glen F
Current Estimated Value
Home Financials for this Owner
Home Financials are based on the most recent Mortgage that was taken out on this home.
Original Mortgage
$247,920
Outstanding Balance
$218,577
Interest Rate
3.6%
Mortgage Type
New Conventional
Estimated Equity
$255,240
Purchase Details
Closed on
Feb 12, 2019
Sold by
Creamer Cristie L
Bought by
Creamer Christie Lynn and The Christie Lynn Creamer Livi
Purchase Details
Closed on
May 3, 1996
Sold by
K D Apartments Llc
Bought by
Creamer Cristie L
Home Financials for this Owner
Home Financials are based on the most recent Mortgage that was taken out on this home.
Original Mortgage
$92,025
Interest Rate
7.68%
Mortgage Type
FHA
Create a Home Valuation Report for This Property
The Home Valuation Report is an in-depth analysis detailing your home's value as well as a comparison with similar homes in the area
Home Values in the Area
Average Home Value in this Area
Purchase History
| Date | Buyer | Sale Price | Title Company |
|---|---|---|---|
| Munk Glen F | -- | First Amer Ttl Legend Hil | |
| Creamer Christie Lynn | -- | None Available | |
| Creamer Cristie L | -- | First American Title |
Source: Public Records
Mortgage History
| Date | Status | Borrower | Loan Amount |
|---|---|---|---|
| Open | Munk Glen F | $247,920 | |
| Previous Owner | Creamer Cristie L | $92,025 |
Source: Public Records
Tax History Compared to Growth
Tax History
| Year | Tax Paid | Tax Assessment Tax Assessment Total Assessment is a certain percentage of the fair market value that is determined by local assessors to be the total taxable value of land and additions on the property. | Land | Improvement |
|---|---|---|---|---|
| 2025 | $2,773 | $442,486 | $135,564 | $306,922 |
| 2024 | $2,707 | $239,249 | $74,560 | $164,689 |
| 2023 | $2,683 | $238,150 | $69,481 | $168,669 |
| 2022 | $2,567 | $233,200 | $58,927 | $174,273 |
| 2021 | $2,264 | $340,000 | $82,869 | $257,131 |
| 2020 | $2,000 | $274,000 | $82,869 | $191,131 |
| 2019 | $1,981 | $256,000 | $48,245 | $207,755 |
| 2018 | $1,899 | $231,000 | $44,461 | $186,539 |
| 2017 | $1,769 | $201,000 | $44,461 | $156,539 |
| 2016 | $1,732 | $106,046 | $23,660 | $82,386 |
| 2015 | $1,565 | $97,626 | $23,660 | $73,966 |
| 2014 | $1,506 | $92,556 | $23,660 | $68,896 |
Source: Public Records
Map
Nearby Homes
- 4635 S 2950 W
- 3084 W 4375 S
- 2979 W 4275 S
- 2816 W 4400 S
- 3014 W 4750 S
- 4440 Stone Creek Rd Unit 2E
- 2802 W 4375 S
- 4510 Stone Creek Rd Unit F
- 2835 W 4200 S
- 3046 W 4850 S
- 4491 Haven Creek Rd Unit A
- 2777 W 4175 S Unit 229
- 4891 S 2875 W
- 4317 S 3350 W
- 2642 W 4400 S
- 2778 W 4175 S Unit 235
- 3434 W 4525 S
- 4918 S 2925 W
- 1952 W 5450 S
- 4875 S 2675 W