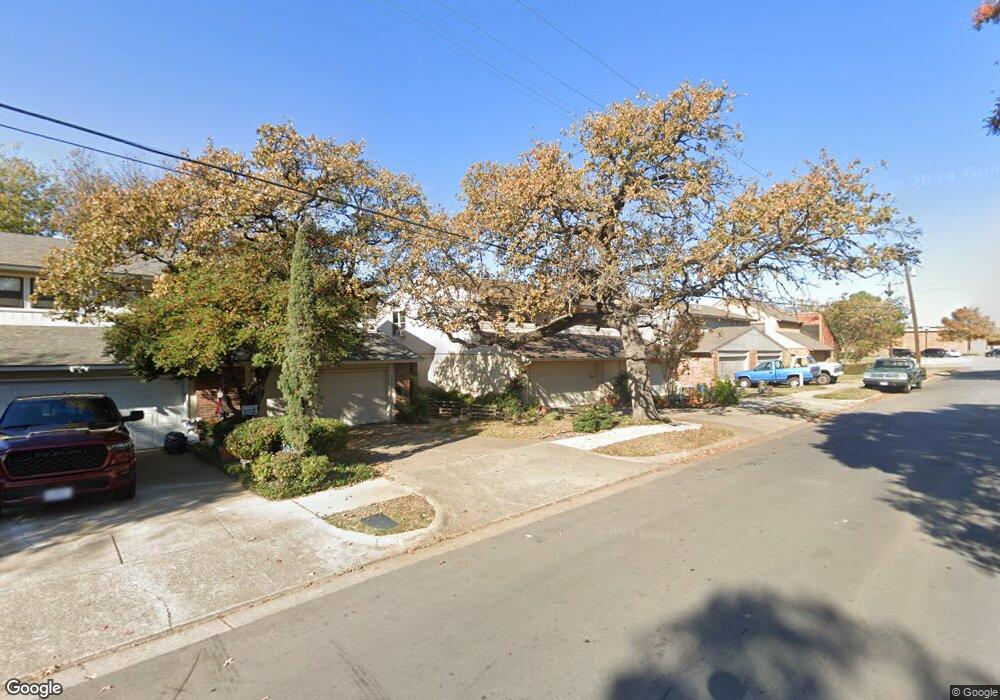
3005 Wayside Dr Bedford, TX 76021
Estimated Value: $267,000 - $287,000
2
Beds
2
Baths
1,260
Sq Ft
$220/Sq Ft
Est. Value
About This Home
This home is located at 3005 Wayside Dr, Bedford, TX 76021 and is currently estimated at $277,139, approximately $219 per square foot. 3005 Wayside Dr is a home located in Tarrant County with nearby schools including Bedford Heights Elementary School, Bedford Junior High School, and L.D. Bell High School.
Ownership History
Date
Name
Owned For
Owner Type
Purchase Details
Closed on
Aug 15, 2002
Sold by
Erickson Wayne C and Erickson Sandra M
Bought by
Lombard Jan
Current Estimated Value
Home Financials for this Owner
Home Financials are based on the most recent Mortgage that was taken out on this home.
Original Mortgage
$73,000
Outstanding Balance
$31,000
Interest Rate
6.6%
Estimated Equity
$246,139
Purchase Details
Closed on
Sep 5, 1995
Sold by
Sunbarger Paul S
Bought by
Erickson Wayne C and Erickson Sandra M
Home Financials for this Owner
Home Financials are based on the most recent Mortgage that was taken out on this home.
Original Mortgage
$56,700
Interest Rate
7.76%
Purchase Details
Closed on
Jan 25, 1995
Sold by
Thompson Thomas E and Thompson Sandra J
Bought by
Sunbarger Paula S
Create a Home Valuation Report for This Property
The Home Valuation Report is an in-depth analysis detailing your home's value as well as a comparison with similar homes in the area
Home Values in the Area
Average Home Value in this Area
Purchase History
| Date | Buyer | Sale Price | Title Company |
|---|---|---|---|
| Lombard Jan | -- | First American Title Co | |
| Erickson Wayne C | -- | American Title Company | |
| Sunbarger Paula S | -- | -- |
Source: Public Records
Mortgage History
| Date | Status | Borrower | Loan Amount |
|---|---|---|---|
| Open | Lombard Jan | $73,000 | |
| Previous Owner | Erickson Wayne C | $56,700 |
Source: Public Records
Tax History Compared to Growth
Tax History
| Year | Tax Paid | Tax Assessment Tax Assessment Total Assessment is a certain percentage of the fair market value that is determined by local assessors to be the total taxable value of land and additions on the property. | Land | Improvement |
|---|---|---|---|---|
| 2025 | $3,125 | $247,941 | $25,000 | $222,941 |
| 2024 | $3,125 | $247,941 | $25,000 | $222,941 |
| 2023 | $3,861 | $249,864 | $25,000 | $224,864 |
| 2022 | $3,997 | $202,211 | $25,000 | $177,211 |
| 2021 | $3,919 | $169,591 | $25,000 | $144,591 |
| 2020 | $3,596 | $170,806 | $25,000 | $145,806 |
| 2019 | $3,340 | $160,724 | $25,000 | $135,724 |
| 2018 | $2,655 | $125,000 | $25,000 | $100,000 |
| 2017 | $3,024 | $125,000 | $25,000 | $100,000 |
| 2016 | $2,999 | $123,951 | $25,000 | $98,951 |
| 2015 | $2,371 | $94,400 | $16,000 | $78,400 |
| 2014 | $2,371 | $94,400 | $16,000 | $78,400 |
Source: Public Records
Map
Nearby Homes
- 432 Sunnybrook Ct
- 320 Blue Quail Ct
- 3213 Spring Valley Dr
- 3119 Spring Grove Dr
- 305 Warbler Dr
- 121 Kay Ct
- 817 Shady Lake Dr
- 124 Jeannie Ct
- 801 Shady Creek Ln
- 1732 Jeannie Ln
- 1740 Brown Trail
- 922 Shady Creek Ln
- 2436 Brookgreen Ct
- 405 Woodbriar Ct
- 913 Kensington Ct
- 3605 Spring Valley Dr
- 1013 Springdale Rd
- 2420 Stonegate Dr N
- 100 Hillview Ct
- 421 Cavender Ct
- 3007 Wayside Dr
- 3003 Wayside Dr
- 3009 Wayside Dr
- 3001 Wayside Dr
- 3002 Carolyn Ct
- 3006 Carolyn Ct
- 3011 Wayside Dr
- 3004 Carolyn Ct
- 3013 Wayside Dr
- 3008 Carolyn Ct
- 229 Wayside Ct
- 225 Wayside Ct
- 233 Wayside Ct
- 300 Rustling Leaves Ln
- 221 Wayside Ct
- 3001 Carolyn Ct
- 3010 Carolyn Ct
- 320 Carolyn Dr
- 217 Wayside Ct
- 302 Rustling Leaves Ln