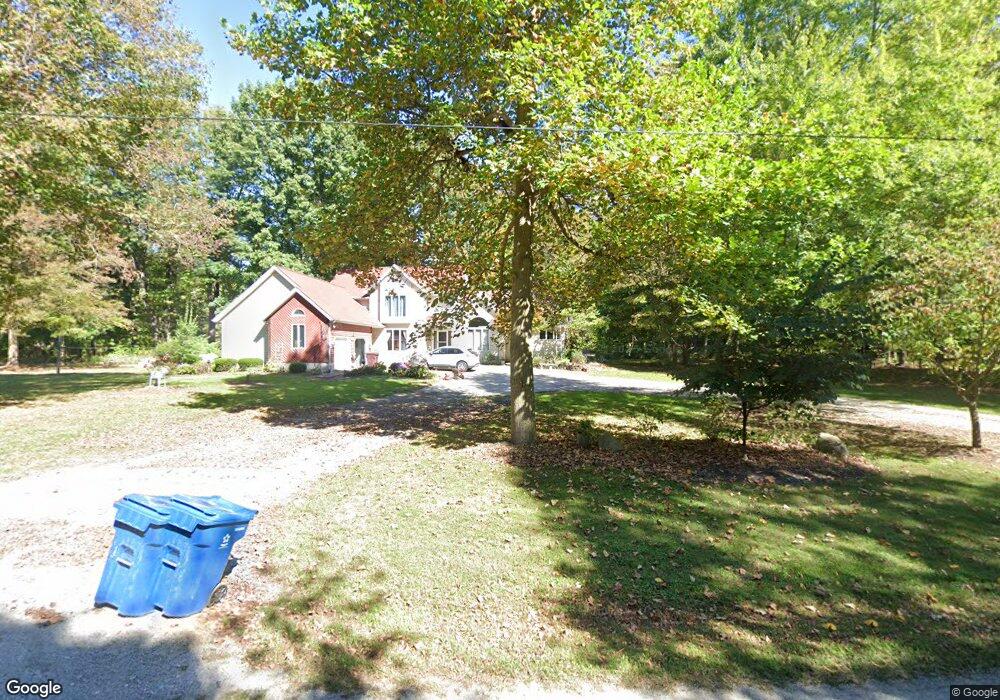
3006 Chenango Rd Wakeman, OH 44889
Estimated Value: $300,000 - $540,000
3
Beds
3
Baths
3,440
Sq Ft
$128/Sq Ft
Est. Value
About This Home
This home is located at 3006 Chenango Rd, Wakeman, OH 44889 and is currently estimated at $440,112, approximately $127 per square foot. 3006 Chenango Rd is a home located in Huron County with nearby schools including Western Reserve Elementary School, Western Reserve Middle School, and Western Reserve High School.
Ownership History
Date
Name
Owned For
Owner Type
Purchase Details
Closed on
Jul 8, 2024
Sold by
Robson Eric T and Robson Lisa M
Bought by
Robson Family Trust and Robson
Current Estimated Value
Purchase Details
Closed on
May 17, 1990
Bought by
Robson Eric T and Robson Lisa M
Create a Home Valuation Report for This Property
The Home Valuation Report is an in-depth analysis detailing your home's value as well as a comparison with similar homes in the area
Purchase History
| Date | Buyer | Sale Price | Title Company |
|---|---|---|---|
| Robson Family Trust | -- | None Listed On Document | |
| Robson Eric T | $16,500 | -- |
Source: Public Records
Tax History
| Year | Tax Paid | Tax Assessment Tax Assessment Total Assessment is a certain percentage of the fair market value that is determined by local assessors to be the total taxable value of land and additions on the property. | Land | Improvement |
|---|---|---|---|---|
| 2024 | $5,057 | $142,040 | $11,830 | $130,210 |
| 2023 | $5,038 | $118,600 | $10,130 | $108,470 |
| 2022 | $4,364 | $118,600 | $10,130 | $108,470 |
| 2021 | $4,497 | $118,600 | $10,130 | $108,470 |
| 2020 | $4,106 | $103,240 | $9,820 | $93,420 |
| 2019 | $4,091 | $103,240 | $9,820 | $93,420 |
| 2018 | $4,048 | $103,240 | $9,820 | $93,420 |
| 2017 | $3,388 | $87,500 | $9,660 | $77,840 |
| 2016 | $3,329 | $87,500 | $9,660 | $77,840 |
| 2015 | $3,297 | $87,510 | $9,670 | $77,840 |
| 2014 | $3,097 | $82,820 | $8,300 | $74,520 |
| 2013 | $2,993 | $82,820 | $8,300 | $74,520 |
Source: Public Records
Map
Nearby Homes
- 5951 Ohio 303
- 34 Cherdon Cir
- 0 0 St Rt 18 E Unit 20260708
- 38 Pleasant St
- 6175 U S 20
- 29 Stony Brook Ln
- 22 E Main St
- 0 Stony Brook Ln
- 42 Stony Brook Ln
- 1491 Vesta Rd
- 27 Deer Run Dr
- 5 Foxwood Cir
- 22 Foxwood Cir
- 4512 Wenz Rd
- 1910 Wenz Rd
- 51344 Betts Rd
- 937 Chenango Rd
- 4883 W River Rd
- 3846 Zenobia Rd
- 3380 Crandall Rd
- 3006 Chenango Rd
- 3022 Chenango Rd
- 3044 Chenango Rd
- 2942 Chenango Rd
- 2951 Chenango Rd
- 2894 Chenango Rd
- 3105 Chenango Rd
- 2840 Chenango Rd
- 2814 Chenango Rd
- 2785 Chenango Rd
- 5801 Auster Rd
- 5775 Auster Rd
- 5863 Auster Rd
- 0 Auster Rd
- 5963 Auster Rd
- 3038 Ohio 60
- 6047 Auster Rd
- 5934 Auster Rd
- 5974 Auster Rd
- 5531 Auster Rd
Your Personal Tour Guide
Ask me questions while you tour the home.