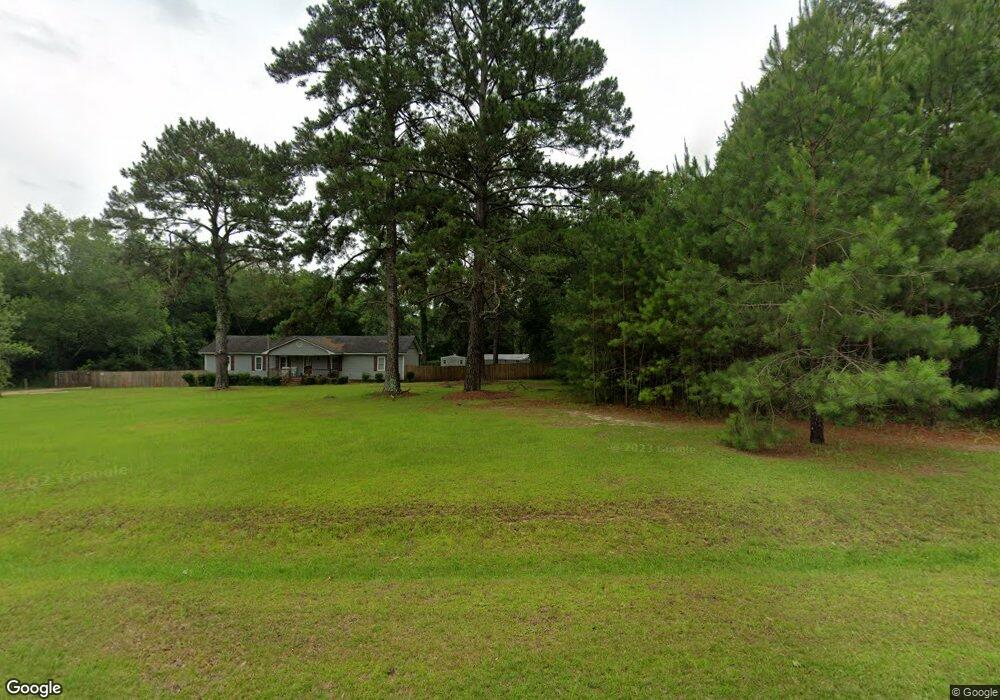
3006 Dove Ave Albany, GA 31721
Estimated Value: $153,000 - $166,691
3
Beds
3
Baths
1,898
Sq Ft
$84/Sq Ft
Est. Value
About This Home
This home is located at 3006 Dove Ave, Albany, GA 31721 and is currently estimated at $159,923, approximately $84 per square foot. 3006 Dove Ave is a home located in Dougherty County with nearby schools including Alice Coachman Elementary School, Southside Middle School, and Monroe High School.
Ownership History
Date
Name
Owned For
Owner Type
Purchase Details
Closed on
Jul 11, 2024
Sold by
Deriso Nicole R
Bought by
Patteson John Louis and Patteson Nicole R
Current Estimated Value
Purchase Details
Closed on
Jul 1, 2024
Sold by
Jones Tracey
Bought by
Bush Jimmy
Purchase Details
Closed on
Aug 22, 2016
Sold by
Nehemiah Cmnty Reinvestment Fu
Bought by
Wallace Michael
Home Financials for this Owner
Home Financials are based on the most recent Mortgage that was taken out on this home.
Original Mortgage
$79,900
Interest Rate
3.45%
Mortgage Type
VA
Purchase Details
Closed on
Mar 9, 2015
Sold by
Bank Of America
Bought by
Nehemiah Community Reinvestmen
Purchase Details
Closed on
Sep 2, 2014
Sold by
Bank Of America
Bought by
Sec Of Housing & Urban
Purchase Details
Closed on
Nov 27, 1996
Sold by
Bulloch Rodney M and Bulloch Lynda T
Bought by
Gaillard Tonya T and Gaillard Charles
Purchase Details
Closed on
Jul 1, 1980
Sold by
Strickland J K
Bought by
Bulloch Rodney M
Create a Home Valuation Report for This Property
The Home Valuation Report is an in-depth analysis detailing your home's value as well as a comparison with similar homes in the area
Home Values in the Area
Average Home Value in this Area
Purchase History
| Date | Buyer | Sale Price | Title Company |
|---|---|---|---|
| Patteson John Louis | -- | -- | |
| Bush Jimmy | -- | -- | |
| Bush Jimmy | -- | -- | |
| Wallace Michael | $79,900 | -- | |
| Nehemiah Community Reinvestmen | -- | -- | |
| Sec Of Housing & Urban | $54,108 | -- | |
| Bank Of America | -- | -- | |
| Gaillard Tonya T | $95,000 | -- | |
| Bulloch Rodney M | $5,000 | -- |
Source: Public Records
Mortgage History
| Date | Status | Borrower | Loan Amount |
|---|---|---|---|
| Previous Owner | Wallace Michael | $79,900 |
Source: Public Records
Tax History Compared to Growth
Tax History
| Year | Tax Paid | Tax Assessment Tax Assessment Total Assessment is a certain percentage of the fair market value that is determined by local assessors to be the total taxable value of land and additions on the property. | Land | Improvement |
|---|---|---|---|---|
| 2024 | -- | $35,960 | $5,200 | $30,760 |
| 2023 | $0 | $35,960 | $5,200 | $30,760 |
| 2022 | $1,543 | $35,960 | $5,200 | $30,760 |
| 2021 | $1,543 | $35,960 | $5,200 | $30,760 |
| 2020 | $1,545 | $35,960 | $5,200 | $30,760 |
| 2019 | $1,549 | $35,960 | $5,200 | $30,760 |
| 2018 | $1,553 | $35,960 | $5,200 | $30,760 |
| 2017 | $1,284 | $35,960 | $5,200 | $30,760 |
| 2016 | $1,446 | $35,960 | $5,200 | $30,760 |
| 2015 | $3,274 | $81,288 | $5,200 | $76,088 |
| 2014 | $3,323 | $83,688 | $7,600 | $76,088 |
Source: Public Records
Map
Nearby Homes
- 0000 Hamilton Dr
- 3610 Slade Ave
- 3710 Coakley Ave
- 2613 Lonesome Rd
- 6413 Newton Rd
- 6224 Newton Rd
- 3211 Higgins Dr
- 4200 Vanderbilt Dr
- 2610 North Ave
- 3108 Higgins Dr
- 5407 Paulk Dr
- 5404 Paulk Dr
- 3432 Aristedes Ct
- 5616 Newton Rd
- 1610 Lily Pond Rd
- 000 Lily Pond Rd
- 1503 Lily Pond Rd
- 906 Lockett Station Rd
- 902 Lockett Station Rd
- 2307 Evergreen Dr
- 3007 Dove Ave
- 3009 Dove Ave
- 3004 Lark Ave
- 3006 Lark Ave
- 3011 Dove Ave
- 3703 Hamilton Dr
- 3000 Dove Ave
- 3003 Dove Ave
- 3707 Hamilton Dr
- 3009 Lark Ave
- 3704 Vanderbilt Dr
- 3700 Hamilton Dr
- 3709 Hamilton Dr
- 2914 Dove Ave
- 3610 Hamilton Dr
- 3015 Lonesome Rd
- 3708 Hamilton Dr
- 3706 Hamilton Dr
- 3601 Hamilton Dr
- 3007 Lonesome Rd