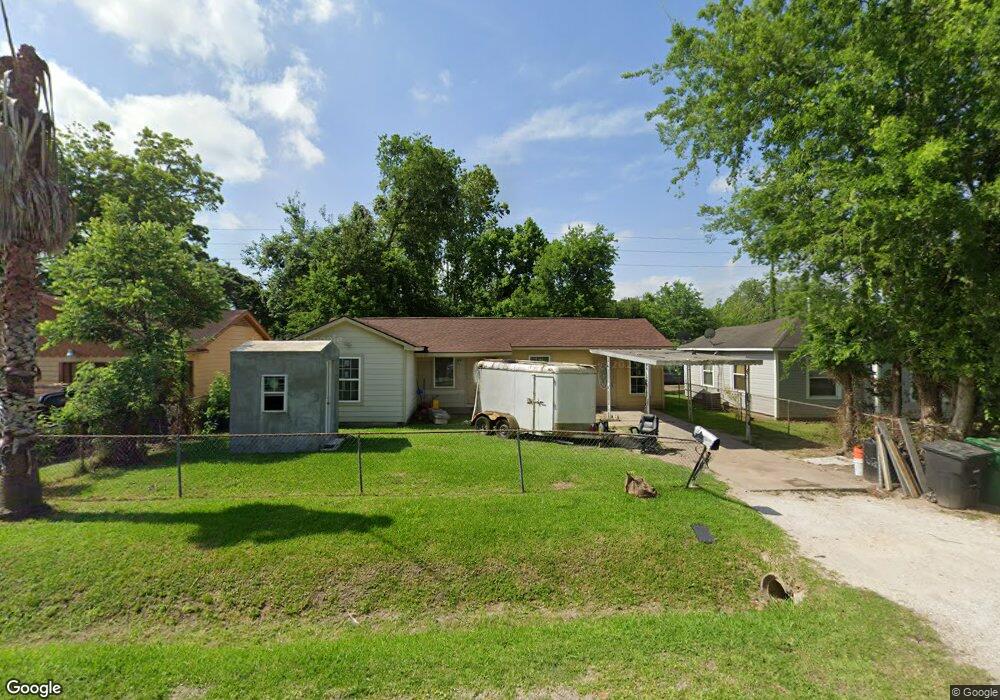
3006 Oklahoma St Houston, TX 77093
Eastex-Jensen NeighborhoodEstimated Value: $138,000 - $172,000
2
Beds
1
Bath
1,189
Sq Ft
$132/Sq Ft
Est. Value
About This Home
This home is located at 3006 Oklahoma St, Houston, TX 77093 and is currently estimated at $156,493, approximately $131 per square foot. 3006 Oklahoma St is a home located in Harris County with nearby schools including Roderick R. Paige Elementary School, Key Middle, and Kashmere High School.
Ownership History
Date
Name
Owned For
Owner Type
Purchase Details
Closed on
Dec 20, 2003
Sold by
Npi Management Lp
Bought by
Ramirez Rosa
Current Estimated Value
Home Financials for this Owner
Home Financials are based on the most recent Mortgage that was taken out on this home.
Original Mortgage
$67,872
Outstanding Balance
$31,758
Interest Rate
6.02%
Mortgage Type
Seller Take Back
Estimated Equity
$124,735
Purchase Details
Closed on
Dec 12, 2003
Sold by
Cox Graeme
Bought by
Npi Management Lp
Home Financials for this Owner
Home Financials are based on the most recent Mortgage that was taken out on this home.
Original Mortgage
$67,872
Outstanding Balance
$31,758
Interest Rate
6.02%
Mortgage Type
Seller Take Back
Estimated Equity
$124,735
Purchase Details
Closed on
Jul 1, 2003
Sold by
Neighborhood Property Investments Lc
Bought by
Cox Graeme
Purchase Details
Closed on
Jun 25, 2002
Sold by
Perry Carmita
Bought by
Neighborhood Property Investments Llc
Purchase Details
Closed on
May 10, 1996
Sold by
Hale Easter Mae
Bought by
Perry Carmita M
Create a Home Valuation Report for This Property
The Home Valuation Report is an in-depth analysis detailing your home's value as well as a comparison with similar homes in the area
Home Values in the Area
Average Home Value in this Area
Purchase History
| Date | Buyer | Sale Price | Title Company |
|---|---|---|---|
| Ramirez Rosa | -- | -- | |
| Npi Management Lp | -- | -- | |
| Cox Graeme | -- | -- | |
| Neighborhood Property Investments Llc | $500 | -- | |
| Perry Carmita M | -- | Fidelity National Title |
Source: Public Records
Mortgage History
| Date | Status | Borrower | Loan Amount |
|---|---|---|---|
| Open | Ramirez Rosa | $67,872 |
Source: Public Records
Tax History Compared to Growth
Tax History
| Year | Tax Paid | Tax Assessment Tax Assessment Total Assessment is a certain percentage of the fair market value that is determined by local assessors to be the total taxable value of land and additions on the property. | Land | Improvement |
|---|---|---|---|---|
| 2025 | $2,267 | $124,657 | $63,911 | $60,746 |
| 2024 | $2,267 | $115,848 | $53,259 | $62,589 |
| 2023 | $2,267 | $112,527 | $47,933 | $64,594 |
| 2022 | $1,903 | $86,420 | $31,956 | $54,464 |
| 2021 | $1,816 | $77,911 | $31,956 | $45,955 |
| 2020 | $1,817 | $75,036 | $31,956 | $43,080 |
| 2019 | $1,915 | $75,683 | $21,304 | $54,379 |
| 2018 | $1,351 | $53,386 | $21,304 | $32,082 |
| 2017 | $1,257 | $53,386 | $21,304 | $32,082 |
| 2016 | $1,143 | $45,207 | $14,202 | $31,005 |
| 2015 | $755 | $45,207 | $14,202 | $31,005 |
| 2014 | $755 | $45,207 | $14,202 | $31,005 |
Source: Public Records
Map
Nearby Homes
- 6806 Schuller Rd
- 3210 Oklahoma St
- 4008 Bennington St
- 7305 Jensen
- 2710 Lynnfield St
- 2707 Lynnfield St
- 2507 Creston Dr
- 3224 Creston Dr
- 7307 Adelbert St
- 2516 Vaughn St
- 3016 King St
- 2503 Creston Dr
- 3425 King St
- 3429 King St
- 7617 Jensen Dr
- 2402 Bennington St
- 3711 Dorchester St
- 3721 Bennington St
- 3401 Melbourne St
- 2821 E Crosstimbers St
- 3010 Oklahoma St
- 3002 Oklahoma St
- 3007 Bennington St
- 3014 Oklahoma St
- 3011 Bennington St
- 3003 Bennington St
- 3015 Bennington St
- 3018 Oklahoma St
- 3005 Oklahoma St
- 3009 Oklahoma St
- 3001 Oklahoma St
- 3019 Bennington St
- 6917 Schuller Rd
- 3015 Oklahoma St
- 3021 Bennington St
- 3102 Oklahoma St
- 2829 Bennington St
- 3019 Oklahoma St
- 6913 Schuller Rd
- 3103 Bennington St