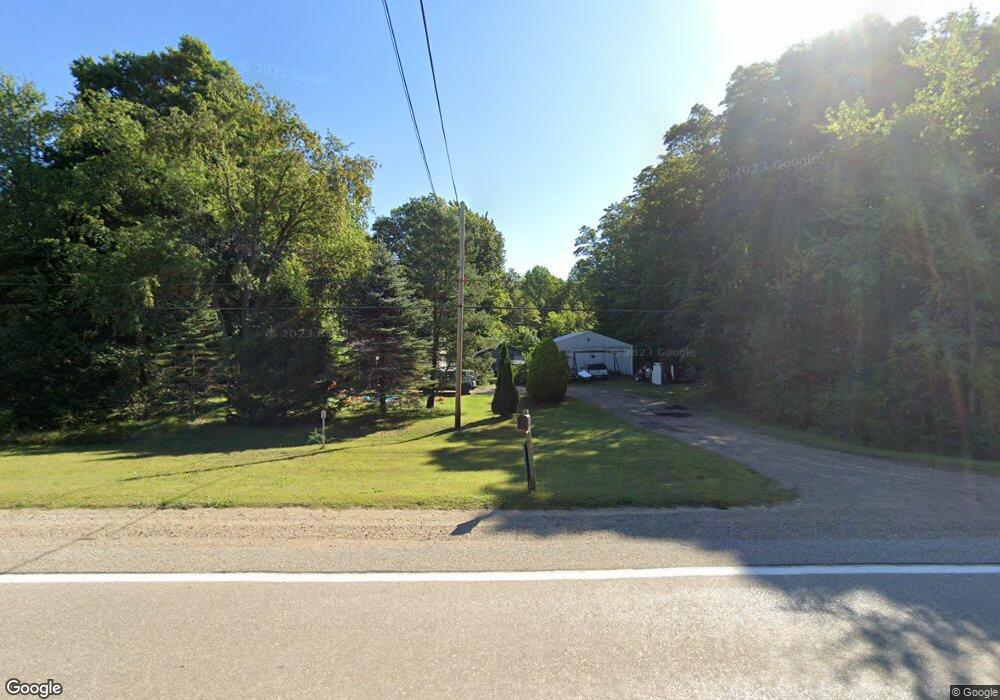
30069 M 140 Hwy Covert, MI 49043
Estimated Value: $77,000 - $187,000
2
Beds
1
Bath
996
Sq Ft
$142/Sq Ft
Est. Value
About This Home
This home is located at 30069 M 140 Hwy, Covert, MI 49043 and is currently estimated at $141,527, approximately $142 per square foot. 30069 M 140 Hwy is a home located in Van Buren County with nearby schools including Covert Elementary School, Covert Middle School, and Covert High School.
Ownership History
Date
Name
Owned For
Owner Type
Purchase Details
Closed on
Feb 23, 2016
Sold by
Wioskowski Dawn and Wioskowski Joseph
Bought by
Nilsen Michael and Nilsen Patti
Current Estimated Value
Purchase Details
Closed on
Aug 25, 2000
Sold by
Sarno James F
Bought by
Wioskowski Dawn D and Wioskowski Joseph A
Purchase Details
Closed on
May 10, 1996
Sold by
Sarno James and Sarno Lois
Bought by
Wioskowski Joseph A
Create a Home Valuation Report for This Property
The Home Valuation Report is an in-depth analysis detailing your home's value as well as a comparison with similar homes in the area
Home Values in the Area
Average Home Value in this Area
Purchase History
| Date | Buyer | Sale Price | Title Company |
|---|---|---|---|
| Nilsen Michael | -- | None Available | |
| Wioskowski Dawn D | -- | -- | |
| Wioskowski Joseph A | $22,500 | -- |
Source: Public Records
Tax History Compared to Growth
Tax History
| Year | Tax Paid | Tax Assessment Tax Assessment Total Assessment is a certain percentage of the fair market value that is determined by local assessors to be the total taxable value of land and additions on the property. | Land | Improvement |
|---|---|---|---|---|
| 2025 | $1,016 | $67,400 | $0 | $0 |
| 2024 | $428 | $62,300 | $0 | $0 |
| 2023 | $408 | $43,000 | $0 | $0 |
| 2022 | $934 | $36,700 | $0 | $0 |
| 2021 | $896 | $32,500 | $2,200 | $30,300 |
| 2020 | $895 | $32,500 | $2,200 | $30,300 |
| 2019 | $862 | $29,300 | $29,300 | $0 |
| 2018 | $824 | $28,200 | $28,200 | $0 |
| 2017 | $888 | $23,600 | $0 | $0 |
| 2016 | $692 | $23,800 | $0 | $0 |
| 2015 | $694 | $23,800 | $0 | $0 |
| 2014 | $681 | $24,400 | $0 | $0 |
| 2013 | -- | $30,000 | $30,000 | $0 |
Source: Public Records
Map
Nearby Homes
- 30295 M 140 Hwy
- 30322 Michigan 140 Unit R
- 30238 M 140 Hwy
- 73838 County Road 378
- 29944 M 140 Hwy
- 29759 Michigan 140
- 30238 Michigan 140
- 30397 M 140 Hwy
- 29868 M 140 Hwy
- 30402 M 140 Hwy
- 73710 County Road 378
- 73563 Cr 37
- 30811 M 140 Hwy
- 74308 30th Ave
- 73563 County Road 378
- 29441 Michigan 140
- 30899 M 140 Hwy
- 30899 M 140 Hwy
- 30919 M 140 Hwy
- 73219 E Cr 37