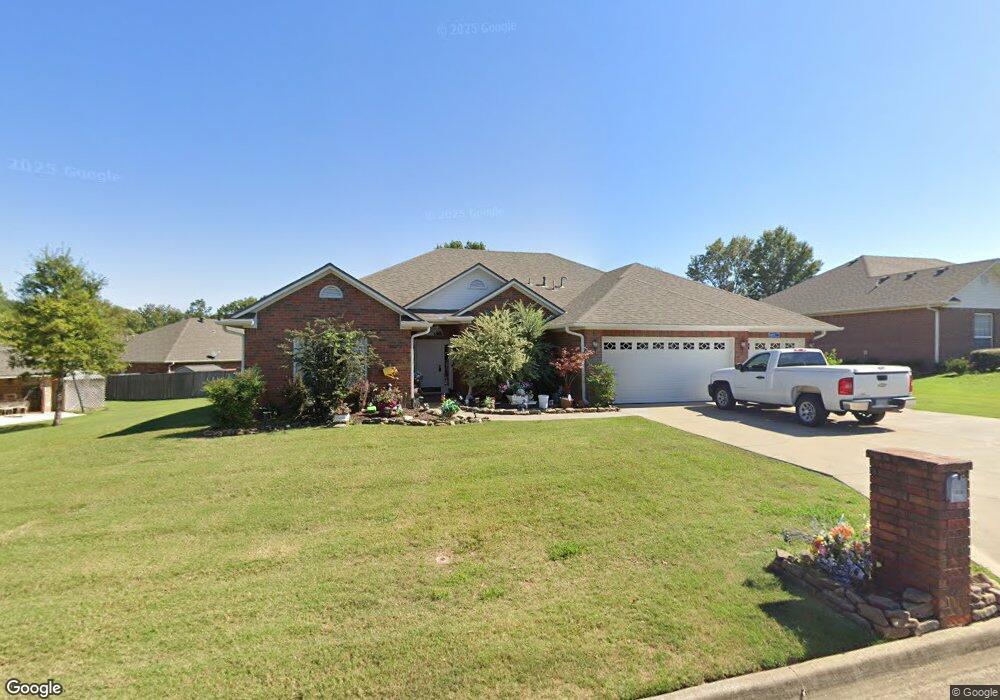
3007 Carrington Pointe Rd Fort Smith, AR 72903
Estimated Value: $337,000 - $370,000
--
Bed
3
Baths
2,542
Sq Ft
$140/Sq Ft
Est. Value
About This Home
This home is located at 3007 Carrington Pointe Rd, Fort Smith, AR 72903 and is currently estimated at $354,924, approximately $139 per square foot. 3007 Carrington Pointe Rd is a home located in Sebastian County with nearby schools including John P. Woods Elementary School, L.A. Chaffin Junior High School, and Southside High School.
Ownership History
Date
Name
Owned For
Owner Type
Purchase Details
Closed on
May 22, 2024
Sold by
George Herman A and George Melanie K
Bought by
George Herman A and George Melanie K
Current Estimated Value
Purchase Details
Closed on
Jul 24, 2021
Sold by
Baker Lydia
Bought by
George Herman A
Purchase Details
Closed on
Apr 16, 2008
Sold by
Hawkins Timothy B
Bought by
George Herman A and Joseph George Lydia J
Home Financials for this Owner
Home Financials are based on the most recent Mortgage that was taken out on this home.
Original Mortgage
$203,000
Interest Rate
6%
Mortgage Type
Purchase Money Mortgage
Purchase Details
Closed on
Oct 31, 1997
Bought by
Hawkins Timothy B and Hawkins Ellen M
Purchase Details
Closed on
Oct 3, 1995
Bought by
Erc Properties Inc
Create a Home Valuation Report for This Property
The Home Valuation Report is an in-depth analysis detailing your home's value as well as a comparison with similar homes in the area
Home Values in the Area
Average Home Value in this Area
Purchase History
| Date | Buyer | Sale Price | Title Company |
|---|---|---|---|
| George Herman A | -- | None Listed On Document | |
| George Herman A | -- | None Available | |
| George Herman A | $231,000 | Mosley Abstract & Title Insu | |
| Hawkins Timothy B | $27,000 | -- | |
| M&M Quality Homes Inc | $27,000 | -- | |
| Erc Properties Inc | -- | -- |
Source: Public Records
Mortgage History
| Date | Status | Borrower | Loan Amount |
|---|---|---|---|
| Previous Owner | George Herman A | $203,000 |
Source: Public Records
Tax History Compared to Growth
Tax History
| Year | Tax Paid | Tax Assessment Tax Assessment Total Assessment is a certain percentage of the fair market value that is determined by local assessors to be the total taxable value of land and additions on the property. | Land | Improvement |
|---|---|---|---|---|
| 2025 | $2,739 | $67,847 | $13,500 | $54,347 |
| 2024 | $2,358 | $44,920 | $9,000 | $35,920 |
| 2023 | $2,183 | $44,920 | $9,000 | $35,920 |
| 2022 | $2,233 | $44,920 | $9,000 | $35,920 |
| 2021 | $2,233 | $44,920 | $9,000 | $35,920 |
| 2020 | $2,233 | $44,920 | $9,000 | $35,920 |
| 2019 | $2,292 | $45,930 | $9,000 | $36,930 |
| 2018 | $2,317 | $45,930 | $9,000 | $36,930 |
| 2017 | $2,061 | $45,930 | $9,000 | $36,930 |
| 2016 | $2,411 | $45,930 | $9,000 | $36,930 |
| 2015 | $2,411 | $45,930 | $9,000 | $36,930 |
| 2014 | $2,158 | $47,780 | $8,000 | $39,780 |
Source: Public Records
Map
Nearby Homes
- 3001 Brighton Point
- 9313 Enid St
- 9005 Lakeside Way
- 2908 Riverbend Dr
- 3021 S 96th St
- 3004 Lake Overlook Ct
- 3008 Lake Overlook Ct
- 2411 Wyndermere Way
- 2912 S 100th St
- 2811 Brighton Ct
- 8909 Copper Oaks Ln
- 10008 Foxboro Rd
- 10101 Foxboro Rd
- 10112 Meandering Way
- 2401 S 87th Dr
- 8813 Canterbury Cove
- 9912 Turtle Bay
- 10000 Turtle Bay
- Lot 4 Cobble Hill Ln
- 8107 Williamsburg Rd
- 3101 Carrington Pointe Rd
- 9406 Carrington Ct
- 9400 Carrington Ct
- 9414 Carrington Ct
- 3105 Carrington Pointe Rd
- 3008 Carrington Pointe Rd
- 3100 Carrington Pointe Rd
- 3100 S 95th St
- 3004 Carrington Pointe Rd
- 3104 Carrington Pointe Rd
- 3104 S 95th St
- 3000 Carrington Pointe Rd
- 9401 Carrington Way
- 9405 Carrington Way
- 3108 Carrington Pointe Rd
- 9409 Carrington Way
- 9405 Carrington Ct
- 9409 Carrington Ct
- 9413 Carrington Way
- 9302 Carrington Ct