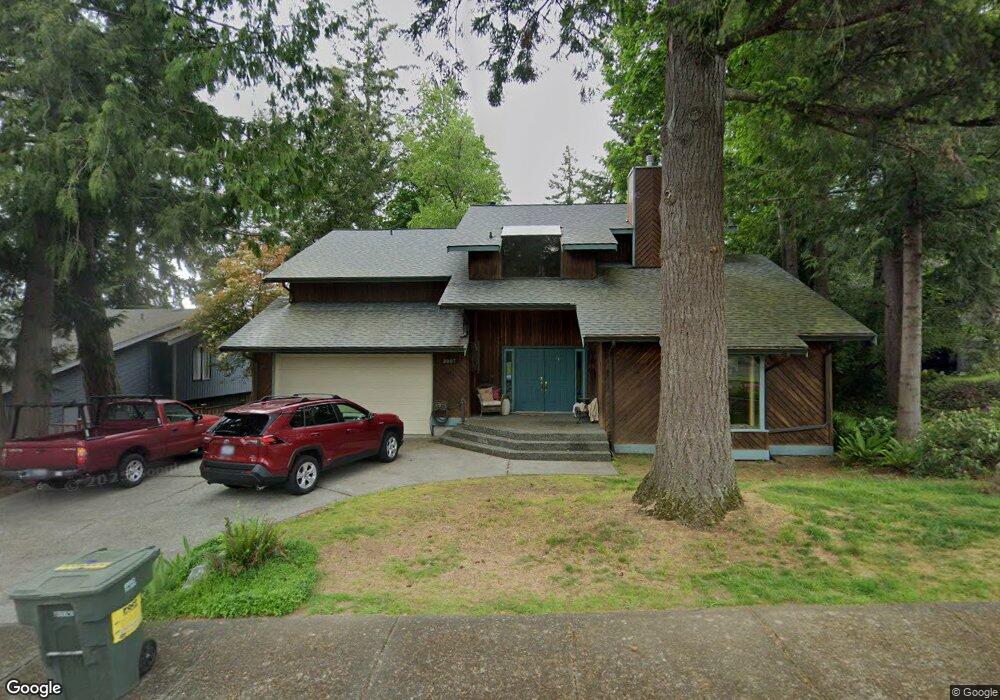
3007 Daniels Ct Bellingham, WA 98229
Alabama Hill NeighborhoodEstimated Value: $874,000 - $998,000
4
Beds
4
Baths
2,624
Sq Ft
$360/Sq Ft
Est. Value
About This Home
This home is located at 3007 Daniels Ct, Bellingham, WA 98229 and is currently estimated at $945,383, approximately $360 per square foot. 3007 Daniels Ct is a home located in Whatcom County with nearby schools including Roosevelt Elementary School, Kulshan Middle School, and Bellingham High School.
Ownership History
Date
Name
Owned For
Owner Type
Purchase Details
Closed on
May 20, 2010
Sold by
Nicoson James B and Cole Susan A
Bought by
Olvera Victor Flores and Flores Maria Timmons
Current Estimated Value
Home Financials for this Owner
Home Financials are based on the most recent Mortgage that was taken out on this home.
Original Mortgage
$184,000
Outstanding Balance
$124,290
Interest Rate
5.21%
Mortgage Type
New Conventional
Estimated Equity
$821,093
Purchase Details
Closed on
Jun 23, 2005
Sold by
Merris John D and Merris Gretchen L
Bought by
Nicoson James B and Cole Susan A
Home Financials for this Owner
Home Financials are based on the most recent Mortgage that was taken out on this home.
Original Mortgage
$287,200
Interest Rate
5.72%
Mortgage Type
Fannie Mae Freddie Mac
Create a Home Valuation Report for This Property
The Home Valuation Report is an in-depth analysis detailing your home's value as well as a comparison with similar homes in the area
Home Values in the Area
Average Home Value in this Area
Purchase History
| Date | Buyer | Sale Price | Title Company |
|---|---|---|---|
| Olvera Victor Flores | $325,280 | Whatcom Land Title | |
| Nicoson James B | $359,000 | Stewart Title Company |
Source: Public Records
Mortgage History
| Date | Status | Borrower | Loan Amount |
|---|---|---|---|
| Open | Olvera Victor Flores | $184,000 | |
| Previous Owner | Nicoson James B | $287,200 |
Source: Public Records
Tax History Compared to Growth
Tax History
| Year | Tax Paid | Tax Assessment Tax Assessment Total Assessment is a certain percentage of the fair market value that is determined by local assessors to be the total taxable value of land and additions on the property. | Land | Improvement |
|---|---|---|---|---|
| 2024 | $7,077 | $871,288 | $244,441 | $626,847 |
| 2023 | $7,077 | $909,600 | $255,189 | $654,411 |
| 2022 | $6,125 | $797,895 | $223,850 | $574,045 |
| 2021 | $4,880 | $659,417 | $185,000 | $474,417 |
| 2020 | $4,717 | $495,860 | $147,982 | $347,878 |
| 2019 | $4,220 | $463,266 | $138,368 | $324,898 |
| 2018 | $4,367 | $415,516 | $124,118 | $291,398 |
| 2017 | $3,797 | $367,652 | $109,820 | $257,832 |
| 2016 | $3,475 | $334,099 | $99,940 | $234,159 |
| 2015 | $3,232 | $318,328 | $95,000 | $223,328 |
| 2014 | -- | $286,405 | $77,400 | $209,005 |
| 2013 | -- | $274,005 | $75,000 | $199,005 |
Source: Public Records
Map
Nearby Homes
- 2209 W Birch St
- 2104 Birch Cir Unit 5C
- 950 Yew St
- 3700 Alabama St Unit 316
- 2138 Woburn St
- 2316 Xenia St
- 2612 Birch St
- 2409 Xenia St
- 4000 Flynn St Unit 50
- 4000 Flynn St Unit 107
- 2325 Valencia St
- 0 Bonanza Way Unit NWM2327531
- 2330 Verona St
- 0 US Highway 27 Hwy N Unit MFRP4936152
- 0 US Highway 27 Hwy N Unit MFRP4935974
- 0 US Highway 27 Hwy N Unit MFRO6335808
- 0 US Highway 27 Hwy N Unit MFRL4957889
- 0 US Highway 27 Hwy N Unit MFRL4952111
- 2735 Michigan St
- 2602 Woburn St
- 3005 Daniels Ct
- 3009 Daniels Ct
- 2012 Niagara Dr
- 2020 Niagara Place
- 2008 Niagara Dr
- 3003 Daniels Ct
- 3017 Daniels Ct
- 3012 Daniels Ct
- 3008 Daniels Ct
- 2016 Niagara Dr
- 3018 Daniels Ct
- 2004 Niagara Dr
- 2024 Niagara Place
- 3016 Daniels Ct
- 3004 Daniels Ct
- 3001 Daniels Ct
- 2000 Niagara Dr
- 3009 Windtree Ct
- 2011 Niagara Dr
- 3000 Daniels Ct