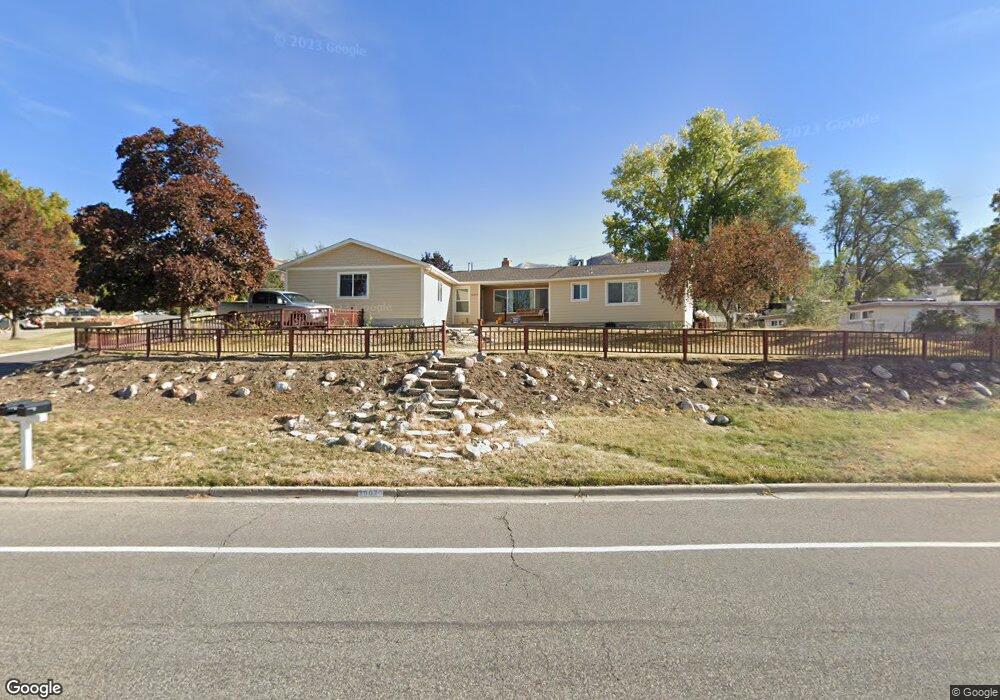
3007 S Davis Blvd Bountiful, UT 84010
Estimated Value: $585,000 - $623,000
5
Beds
3
Baths
2,482
Sq Ft
$241/Sq Ft
Est. Value
About This Home
This home is located at 3007 S Davis Blvd, Bountiful, UT 84010 and is currently estimated at $598,697, approximately $241 per square foot. 3007 S Davis Blvd is a home located in Davis County with nearby schools including Boulton School, South Davis Junior High School, and Woods Cross High School.
Ownership History
Date
Name
Owned For
Owner Type
Purchase Details
Closed on
Jul 9, 2001
Sold by
Pace Ghentry Andrew and Pace Emma
Bought by
Dunn Christopher W and Dunn Heather G
Current Estimated Value
Home Financials for this Owner
Home Financials are based on the most recent Mortgage that was taken out on this home.
Original Mortgage
$137,600
Outstanding Balance
$52,874
Interest Rate
7.26%
Estimated Equity
$545,823
Purchase Details
Closed on
Aug 16, 1996
Sold by
Kunkel Jon Christopher and Stokes Kunkel Stacey
Bought by
Pace Ghentry Andrew and Pace Emma
Home Financials for this Owner
Home Financials are based on the most recent Mortgage that was taken out on this home.
Original Mortgage
$135,350
Interest Rate
8.18%
Create a Home Valuation Report for This Property
The Home Valuation Report is an in-depth analysis detailing your home's value as well as a comparison with similar homes in the area
Purchase History
| Date | Buyer | Sale Price | Title Company |
|---|---|---|---|
| Dunn Christopher W | -- | Security Title Insurance Age | |
| Pace Ghentry Andrew | -- | First American Title Co |
Source: Public Records
Mortgage History
| Date | Status | Borrower | Loan Amount |
|---|---|---|---|
| Open | Dunn Christopher W | $137,600 | |
| Previous Owner | Pace Ghentry Andrew | $135,350 |
Source: Public Records
Tax History
| Year | Tax Paid | Tax Assessment Tax Assessment Total Assessment is a certain percentage of the fair market value that is determined by local assessors to be the total taxable value of land and additions on the property. | Land | Improvement |
|---|---|---|---|---|
| 2025 | $3,389 | $312,400 | $129,515 | $182,885 |
| 2024 | $3,378 | $317,350 | $119,376 | $197,974 |
| 2023 | $3,295 | $559,000 | $216,924 | $342,076 |
| 2022 | $3,359 | $318,450 | $115,576 | $202,874 |
| 2021 | $3,076 | $447,000 | $171,819 | $275,181 |
| 2020 | $2,695 | $393,000 | $156,441 | $236,559 |
| 2019 | $2,430 | $348,000 | $134,574 | $213,426 |
| 2018 | $2,276 | $321,000 | $131,808 | $189,192 |
| 2016 | $2,251 | $179,960 | $43,486 | $136,474 |
| 2015 | $2,187 | $165,330 | $43,486 | $121,844 |
| 2014 | $2,197 | $169,847 | $43,486 | $126,361 |
| 2013 | -- | $132,751 | $37,720 | $95,031 |
Source: Public Records
Map
Nearby Homes
- 11 E Bonneville Dr
- 69 E North Canyon Rd
- 8 E 3500 S
- 438 Indian Springs Rd
- 337 W 2900 S
- 424 E Canyon Estates Dr S
- 19 E North Canyon Rd
- 3716 S Oakridge Cir
- 336 W 3500 S
- 3551 S Huntington Dr
- 404 W 2700 S
- 2292 S 250 E
- 110 2250 S
- 468 W 3200 S
- 2273 S 200 E
- 610 Meadowlark Ln
- 41 E 2200 S
- 3433 S 525 W
- 552 W 2900 S
- 554 W 2900 S
- 3019 S Davis Blvd
- 36 E 3000 S
- 52 E 3000 S
- 2971 S Davis Blvd
- 3037 S Davis Blvd
- 3004 S Davis Blvd
- 3016 S Davis Blvd
- 62 E 3000 S
- 2972 S Davis Blvd
- 2961 S Davis Blvd
- 67 E 3000 S
- 2967 S 50 W
- 2964 S Davis Blvd
- 3053 S Davis Blvd
- 76 E 3000 S
- 2947 S Davis Blvd
- 19 E 3100 S
- 2947 S 50 W
- 3036 S Davis Blvd
- 12 W 3100 S
Your Personal Tour Guide
Ask me questions while you tour the home.