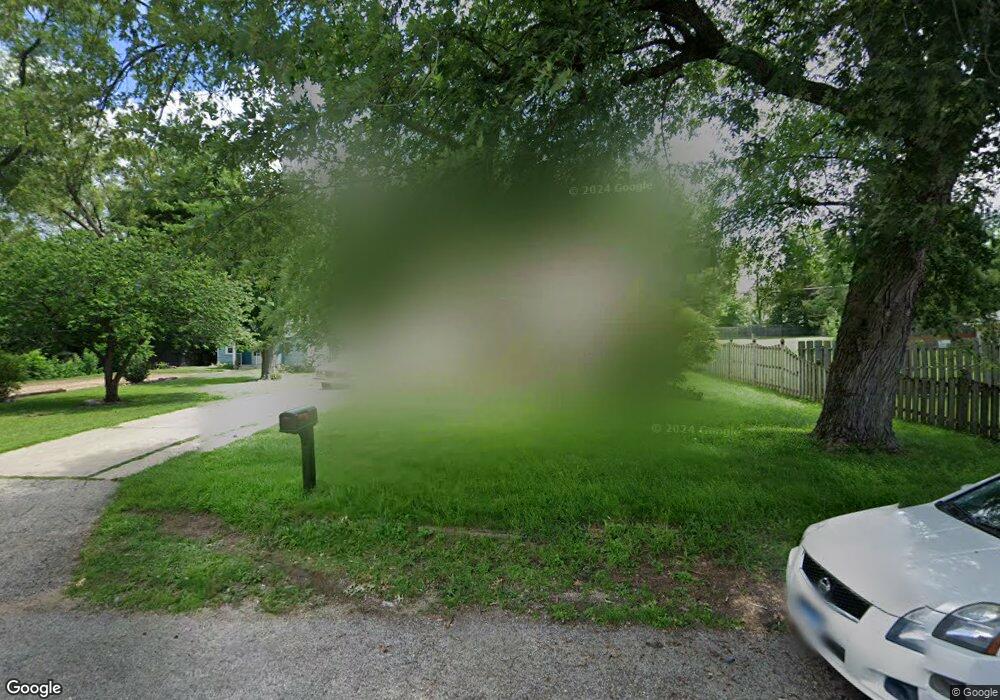
3008 Cannon St Rockford, IL 61109
Southeast Helping Hands NeighborhoodEstimated Value: $127,771 - $155,000
4
Beds
2
Baths
1,650
Sq Ft
$83/Sq Ft
Est. Value
About This Home
This home is located at 3008 Cannon St, Rockford, IL 61109 and is currently estimated at $137,443, approximately $83 per square foot. 3008 Cannon St is a home located in Winnebago County with nearby schools including Riverdahl Elementary School, Rockford Environmental Science Academy, and Jefferson High School.
Ownership History
Date
Name
Owned For
Owner Type
Purchase Details
Closed on
Mar 19, 2009
Sold by
Win Win Transactions Llc
Bought by
Moore Johnathan S and Moore Debretta
Current Estimated Value
Home Financials for this Owner
Home Financials are based on the most recent Mortgage that was taken out on this home.
Original Mortgage
$87,387
Interest Rate
3.75%
Mortgage Type
FHA
Create a Home Valuation Report for This Property
The Home Valuation Report is an in-depth analysis detailing your home's value as well as a comparison with similar homes in the area
Home Values in the Area
Average Home Value in this Area
Purchase History
| Date | Buyer | Sale Price | Title Company |
|---|---|---|---|
| Moore Johnathan S | $89,000 | Metropolitan Title Co | |
| Moore Johnathan S | $89,000 | -- |
Source: Public Records
Mortgage History
| Date | Status | Borrower | Loan Amount |
|---|---|---|---|
| Previous Owner | Moore Johnathan S | $87,387 | |
| Closed | Moore Johnathan S | $87,387 |
Source: Public Records
Tax History Compared to Growth
Tax History
| Year | Tax Paid | Tax Assessment Tax Assessment Total Assessment is a certain percentage of the fair market value that is determined by local assessors to be the total taxable value of land and additions on the property. | Land | Improvement |
|---|---|---|---|---|
| 2024 | $2,329 | $30,579 | $1,692 | $28,887 |
| 2023 | $2,177 | $26,963 | $1,492 | $25,471 |
| 2022 | $2,068 | $24,100 | $1,334 | $22,766 |
| 2021 | $997 | $9,081 | $1,223 | $7,858 |
| 2020 | $1,046 | $8,585 | $1,156 | $7,429 |
| 2019 | $2,179 | $22,267 | $1,102 | $21,165 |
| 2018 | $2,300 | $22,263 | $1,039 | $21,224 |
| 2017 | $2,271 | $21,306 | $994 | $20,312 |
| 2016 | $2,252 | $20,906 | $975 | $19,931 |
| 2015 | $2,280 | $20,906 | $975 | $19,931 |
| 2014 | $2,469 | $22,243 | $1,219 | $21,024 |
Source: Public Records
Map
Nearby Homes
- 2905 Sewell St
- 3009 Sewell St
- 2140/2144 Reed Ave Unit 2144 Reed Avenue
- 1742 Pershing Ave
- 2946 Marshall St
- 2140 Reed Ave
- 2712 Sewell St
- 29xx Kinsey St
- 3134 Sewell St
- 3122 18th St
- 3120 17th St
- 2817 9th St
- 2934 Collins St
- 1734 Sandy Hollow Rd
- 2413 Lindberg Dr
- 2031 Sandy Hollow Rd
- 3429 Ed Vera Dr
- 2929 23rd St
- 2228 10th St
- 2204 9th St