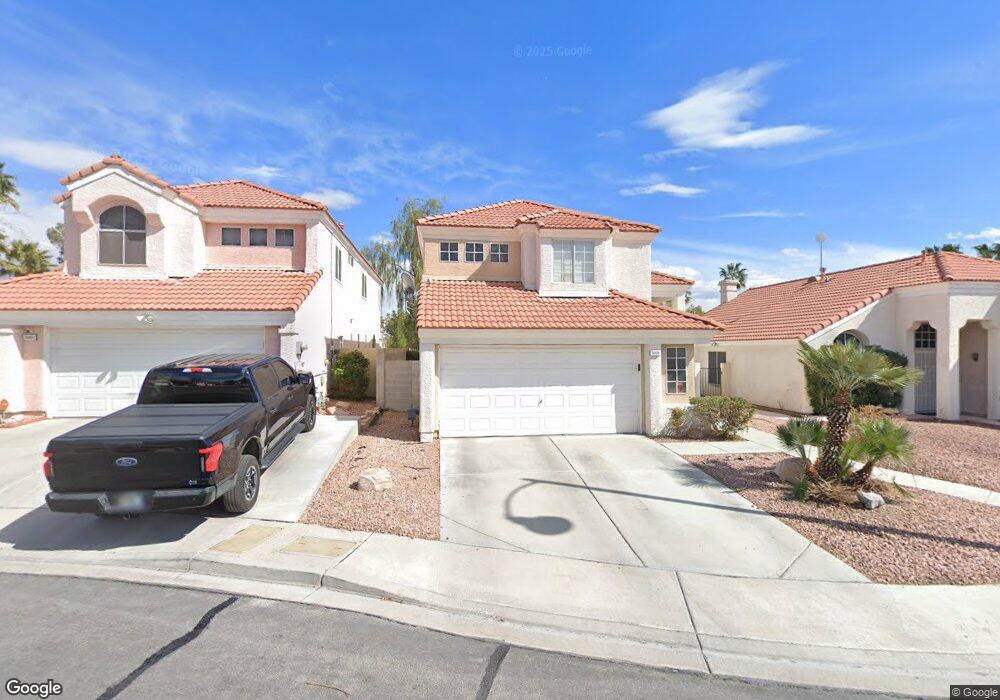
3008 Cloverbrook St Unit n/a Las Vegas, NV 89117
The Section Seven NeighborhoodEstimated Value: $440,000 - $468,000
3
Beds
3
Baths
1,710
Sq Ft
$266/Sq Ft
Est. Value
About This Home
This home is located at 3008 Cloverbrook St Unit n/a, Las Vegas, NV 89117 and is currently estimated at $455,547, approximately $266 per square foot. 3008 Cloverbrook St Unit n/a is a home located in Clark County with nearby schools including M J Christensen Elementary School, Clifford J Lawrence Junior High School, and Bonanza High School.
Ownership History
Date
Name
Owned For
Owner Type
Purchase Details
Closed on
Jul 16, 2008
Sold by
Randolph Diane
Bought by
Randolph Ronald
Current Estimated Value
Purchase Details
Closed on
Jul 15, 2008
Sold by
Randolph Ronald
Bought by
Schivo Michael and Michael Schivo Living Trust
Purchase Details
Closed on
May 25, 2001
Sold by
Moroz Don and Moroz Eddie S
Bought by
Randolph Ronald
Home Financials for this Owner
Home Financials are based on the most recent Mortgage that was taken out on this home.
Original Mortgage
$143,910
Interest Rate
9.87%
Purchase Details
Closed on
May 22, 2001
Sold by
Moroz Kelly D
Bought by
Moroz Eddies S
Home Financials for this Owner
Home Financials are based on the most recent Mortgage that was taken out on this home.
Original Mortgage
$143,910
Interest Rate
9.87%
Purchase Details
Closed on
Oct 8, 1996
Sold by
Moroz Don and Moroz Eddie S
Bought by
Blunck Louisa and The Louisa Blanck Trust
Purchase Details
Closed on
Oct 2, 1996
Sold by
Blunck Louisa
Bought by
Moroz Don and Moroz Eddies S
Create a Home Valuation Report for This Property
The Home Valuation Report is an in-depth analysis detailing your home's value as well as a comparison with similar homes in the area
Home Values in the Area
Average Home Value in this Area
Purchase History
| Date | Buyer | Sale Price | Title Company |
|---|---|---|---|
| Randolph Ronald | -- | North American Title Sahara | |
| Schivo Michael | $193,000 | North American Title Sahara | |
| Randolph Ronald | $159,900 | Fidelity National Title | |
| Moroz Eddies S | -- | Fidelity National Title | |
| Blunck Louisa | -- | -- | |
| Moroz Don | -- | -- |
Source: Public Records
Mortgage History
| Date | Status | Borrower | Loan Amount |
|---|---|---|---|
| Previous Owner | Randolph Ronald | $143,910 |
Source: Public Records
Tax History Compared to Growth
Tax History
| Year | Tax Paid | Tax Assessment Tax Assessment Total Assessment is a certain percentage of the fair market value that is determined by local assessors to be the total taxable value of land and additions on the property. | Land | Improvement |
|---|---|---|---|---|
| 2025 | $2,447 | $84,912 | $36,575 | $48,337 |
| 2024 | $2,266 | $84,912 | $36,575 | $48,337 |
| 2023 | $2,266 | $78,399 | $31,920 | $46,479 |
| 2022 | $2,099 | $70,951 | $27,930 | $43,021 |
| 2021 | $1,943 | $64,896 | $23,608 | $41,288 |
| 2020 | $1,802 | $64,844 | $23,608 | $41,236 |
| 2019 | $1,689 | $62,132 | $21,280 | $40,852 |
| 2018 | $1,611 | $56,513 | $17,010 | $39,503 |
| 2017 | $1,871 | $57,048 | $16,695 | $40,353 |
| 2016 | $1,509 | $53,624 | $12,915 | $40,709 |
| 2015 | $1,505 | $44,958 | $11,025 | $33,933 |
| 2014 | $1,458 | $43,152 | $7,875 | $35,277 |
Source: Public Records
Map
Nearby Homes
- 3001 Bridge Creek St
- 9724 Cascade Falls Ave
- 9713 Cascade Falls Ave
- 9717 Sierra Mesa Ave
- 9708 Blazing Star Ct
- 9624 Beach Water Cir
- 9605 Blowing Sand Cir
- 2821 Willow Wind Ct
- 9548 Wooden Pier Way
- 2909 Ivory Reef Ct
- 2728 Monrovia Dr
- 2724 Monrovia Dr
- 9544 Lazy River Dr
- 9504 Cliff View Way
- 9612 Chianti Ln
- 9833 Dardanelle Ct
- 3213 Shallow Point Cir
- 9429 Abalone Way
- 9820 Cross Creek Way
- 10025 Harpoon Cir
- 3008 Cloverbrook St
- 3012 Cloverbrook St
- 3004 Cloverbrook St
- 3017 Bridge Creek St
- 3013 Bridge Creek St
- 9805 Cactus View Ave
- 3000 Cloverbrook St
- 3020 Cloverbrook St
- 9800 Cactus View Ave
- 3009 Bridge Creek St
- 9800 Virginia Woods Cir
- 9809 Cactus View Ave
- 3024 Cloverbrook St
- 9733 Terrace Green Ave
- 3021 Pebblestone Cir
- 9804 Cactus View Ave
- 9804 Virginia Woods Cir
- 9813 Cactus View Ave
- 9813 Cactus View Ave
- 9813 Cactus View Ave