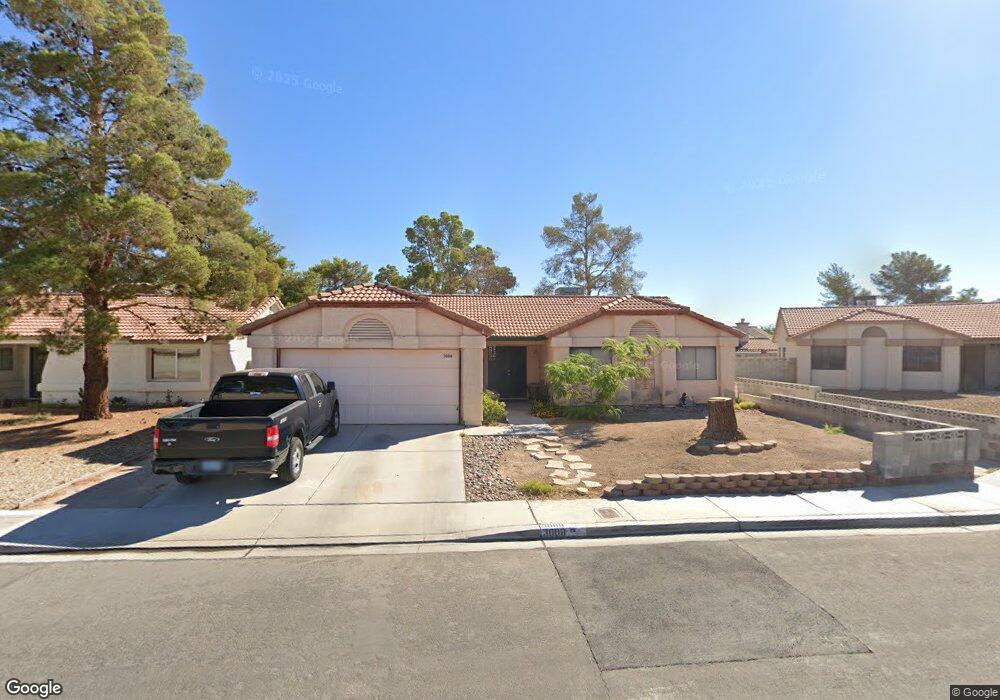
3008 Gentle Breeze St Las Vegas, NV 89108
Michael Way NeighborhoodEstimated Value: $367,684 - $391,000
4
Beds
2
Baths
1,236
Sq Ft
$310/Sq Ft
Est. Value
About This Home
This home is located at 3008 Gentle Breeze St, Las Vegas, NV 89108 and is currently estimated at $383,421, approximately $310 per square foot. 3008 Gentle Breeze St is a home located in Clark County with nearby schools including Berkeley L. Bunker Elementary School, Irwin & Susan Molasky Junior High School, and Cimarron Memorial High School.
Ownership History
Date
Name
Owned For
Owner Type
Purchase Details
Closed on
Oct 19, 2005
Sold by
Monsouir Elsie Anne
Bought by
Monsouir Elsie and Bawden Vicki
Current Estimated Value
Home Financials for this Owner
Home Financials are based on the most recent Mortgage that was taken out on this home.
Original Mortgage
$126,000
Outstanding Balance
$67,058
Interest Rate
5.67%
Mortgage Type
New Conventional
Estimated Equity
$316,363
Purchase Details
Closed on
Nov 16, 1998
Sold by
Monsouir Fred and Monsouir Elsie Anne
Bought by
Monsouir Fred J and Monsouir Elsie Anne
Home Financials for this Owner
Home Financials are based on the most recent Mortgage that was taken out on this home.
Original Mortgage
$108,640
Interest Rate
6.42%
Mortgage Type
FHA
Purchase Details
Closed on
Jun 18, 1997
Sold by
Monsouir Fred
Bought by
Monsouir Fred and Monsouir Elsie Anne
Purchase Details
Closed on
Sep 8, 1993
Sold by
Monsouir Patricia A and Monsouir Eleanor A
Bought by
Monsouir Eleanor A and Monsouir Fred
Create a Home Valuation Report for This Property
The Home Valuation Report is an in-depth analysis detailing your home's value as well as a comparison with similar homes in the area
Home Values in the Area
Average Home Value in this Area
Purchase History
| Date | Buyer | Sale Price | Title Company |
|---|---|---|---|
| Monsouir Elsie | -- | Southwest Title | |
| Monsouir Fred J | -- | Lawyers Title | |
| Monsouir Fred | -- | -- | |
| Monsouir Eleanor A | -- | -- |
Source: Public Records
Mortgage History
| Date | Status | Borrower | Loan Amount |
|---|---|---|---|
| Open | Monsouir Elsie | $126,000 | |
| Closed | Monsouir Fred J | $108,640 |
Source: Public Records
Tax History Compared to Growth
Tax History
| Year | Tax Paid | Tax Assessment Tax Assessment Total Assessment is a certain percentage of the fair market value that is determined by local assessors to be the total taxable value of land and additions on the property. | Land | Improvement |
|---|---|---|---|---|
| 2025 | $1,138 | $64,502 | $29,050 | $35,452 |
| 2024 | $1,105 | $64,502 | $29,050 | $35,452 |
| 2023 | $904 | $62,554 | $28,350 | $34,204 |
| 2022 | $1,076 | $53,196 | $21,700 | $31,496 |
| 2021 | $1,046 | $51,202 | $21,000 | $30,202 |
| 2020 | $1,012 | $49,467 | $19,250 | $30,217 |
| 2019 | $982 | $47,864 | $17,850 | $30,014 |
| 2018 | $954 | $43,057 | $14,000 | $29,057 |
| 2017 | $1,339 | $42,179 | $12,600 | $29,579 |
| 2016 | $904 | $41,297 | $11,200 | $30,097 |
| 2015 | $901 | $37,965 | $8,050 | $29,915 |
| 2014 | $875 | $29,410 | $5,600 | $23,810 |
Source: Public Records
Map
Nearby Homes
- 6612 Gentle Winds Ct
- 3100 Garehime St
- 3116 Gentle Breeze St
- 6632 Light Breeze Dr
- 6544 Old Oxford Ave
- 6632 Coastal Breeze Ct
- 6612 Old Newbury Ave
- 2912 Drury St
- 2809 Du Barry Manor Ln
- 6536 Castor Tree Way
- 2789 Trotwood Ln
- 3265 Mustang St
- 2801 N Rainbow Blvd Unit 252
- 2801 N Rainbow Blvd Unit 103
- 2801 N Rainbow Blvd Unit 273
- 6428 Yarmouth Dr
- 2764 Trotwood Ln
- 6705 Shallow Creek Ct
- 2700 N Rainbow Blvd Unit 1137
- 2915 Maverick St
- 3012 Gentle Breeze St
- 3004 Gentle Breeze St
- 3021 Garehime St
- 3016 Gentle Breeze St
- 3011 Garehime St
- 6604 Gentle Winds Ct
- 3031 Garehime St
- 3000 Gentle Breeze St
- 6601 Light Breeze Dr
- 3020 Gentle Breeze St
- 6601 Gentle Winds Ct
- 6608 Gentle Winds Ct
- 3001 Garehime St
- 6605 Gentle Winds Ct
- 6605 Light Breeze Dr
- 3041 Garehime St
- 3024 Gentle Breeze St
- 6548 Silver Penny Ave
- 6552 Silver Penny Ave
- 6609 Gentle Winds Ct