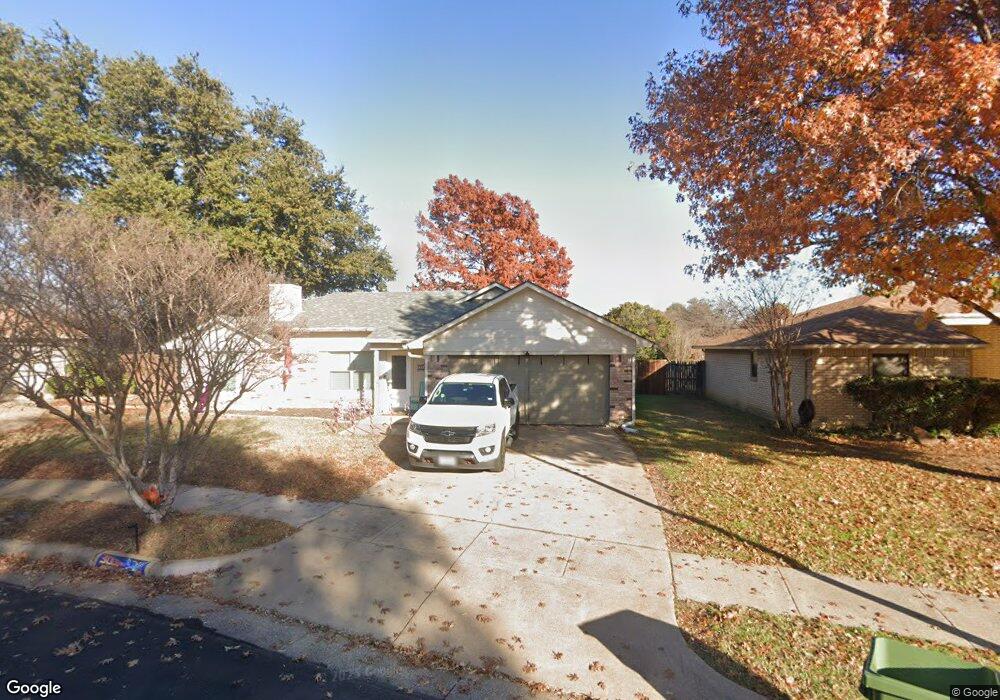
3008 Homecraft Ct Bedford, TX 76021
Estimated Value: $352,554 - $389,000
3
Beds
2
Baths
1,690
Sq Ft
$222/Sq Ft
Est. Value
About This Home
This home is located at 3008 Homecraft Ct, Bedford, TX 76021 and is currently estimated at $374,889, approximately $221 per square foot. 3008 Homecraft Ct is a home located in Tarrant County with nearby schools including Spring Garden Elementary School, Harwood Junior High School, and Trinity High School.
Ownership History
Date
Name
Owned For
Owner Type
Purchase Details
Closed on
Apr 21, 2021
Sold by
Durant Daniel L and Durant Brenda G
Bought by
Flores Michael Henry and Flores Andrea Gail
Current Estimated Value
Home Financials for this Owner
Home Financials are based on the most recent Mortgage that was taken out on this home.
Original Mortgage
$291,620
Outstanding Balance
$263,508
Interest Rate
3.05%
Mortgage Type
FHA
Estimated Equity
$111,381
Purchase Details
Closed on
Oct 9, 2009
Sold by
Smith Jane J
Bought by
Durant Daniel L
Home Financials for this Owner
Home Financials are based on the most recent Mortgage that was taken out on this home.
Original Mortgage
$145,053
Interest Rate
5.1%
Mortgage Type
VA
Create a Home Valuation Report for This Property
The Home Valuation Report is an in-depth analysis detailing your home's value as well as a comparison with similar homes in the area
Home Values in the Area
Average Home Value in this Area
Purchase History
| Date | Buyer | Sale Price | Title Company |
|---|---|---|---|
| Flores Michael Henry | -- | Designated Ttl Llc Southlake | |
| Durant Daniel L | -- | Providence Title Company |
Source: Public Records
Mortgage History
| Date | Status | Borrower | Loan Amount |
|---|---|---|---|
| Open | Flores Michael Henry | $291,620 | |
| Previous Owner | Durant Daniel L | $145,053 |
Source: Public Records
Tax History Compared to Growth
Tax History
| Year | Tax Paid | Tax Assessment Tax Assessment Total Assessment is a certain percentage of the fair market value that is determined by local assessors to be the total taxable value of land and additions on the property. | Land | Improvement |
|---|---|---|---|---|
| 2025 | $5,162 | $356,451 | $75,000 | $281,451 |
| 2024 | $5,162 | $356,451 | $75,000 | $281,451 |
| 2023 | $5,758 | $328,815 | $45,000 | $283,815 |
| 2022 | $5,961 | $272,933 | $45,000 | $227,933 |
| 2021 | $5,738 | $259,006 | $45,000 | $214,006 |
| 2020 | $5,265 | $242,541 | $45,000 | $197,541 |
| 2019 | $4,891 | $244,147 | $45,000 | $199,147 |
| 2018 | $4,064 | $183,013 | $45,000 | $138,013 |
| 2017 | $4,025 | $208,186 | $18,000 | $190,186 |
| 2016 | $3,659 | $194,533 | $18,000 | $176,533 |
| 2015 | $3,148 | $137,500 | $18,000 | $119,500 |
| 2014 | $3,148 | $137,500 | $18,000 | $119,500 |
Source: Public Records
Map
Nearby Homes
- 2220 Tiffany Glenn Ct
- 2909 Oakridge Dr
- 3532 Meadowside Dr
- 3152 Woodbridge Dr
- 3513 Meadowside Dr
- 2922 Beachtree Ln
- 22 Lincolnshire Cir
- 2209 Laurel Ct
- 1723 Post Oak Dr
- 2600 Willow Bend
- 2109 Oakmeadow St
- 1800 Hampton Dr
- 2112 Oakmeadow Place
- 3024 Highgate Ln
- 2521 Sanders Ct
- 1704 Indian Oaks Ct
- 1630 Post Oak Dr
- 1636 Bedford Oaks Dr
- 2616 Greenwood Ct
- 3840 Edgewater Dr
- 3004 Homecraft Ct
- 3012 Homecraft Ct
- 3017 Homecraft Ct
- 2119 Homecraft Dr
- 2113 Homecraft Dr
- 2200 Sequoia Ln
- 3005 Homecraft Ct
- 3036 Richwood Cir
- 3032 Richwood Cir
- 3013 Homecraft Ct
- 3101 Redwood St
- 3028 Richwood Cir
- 3009 Homecraft Ct
- 3001 Homecraft Ct
- 2201 Homecraft Ln
- 2204 Sequoia Ln
- 3024 Richwood Cir
- 3105 Redwood St
- 2101 Homecraft Dr
- 3020 Richwood Cir