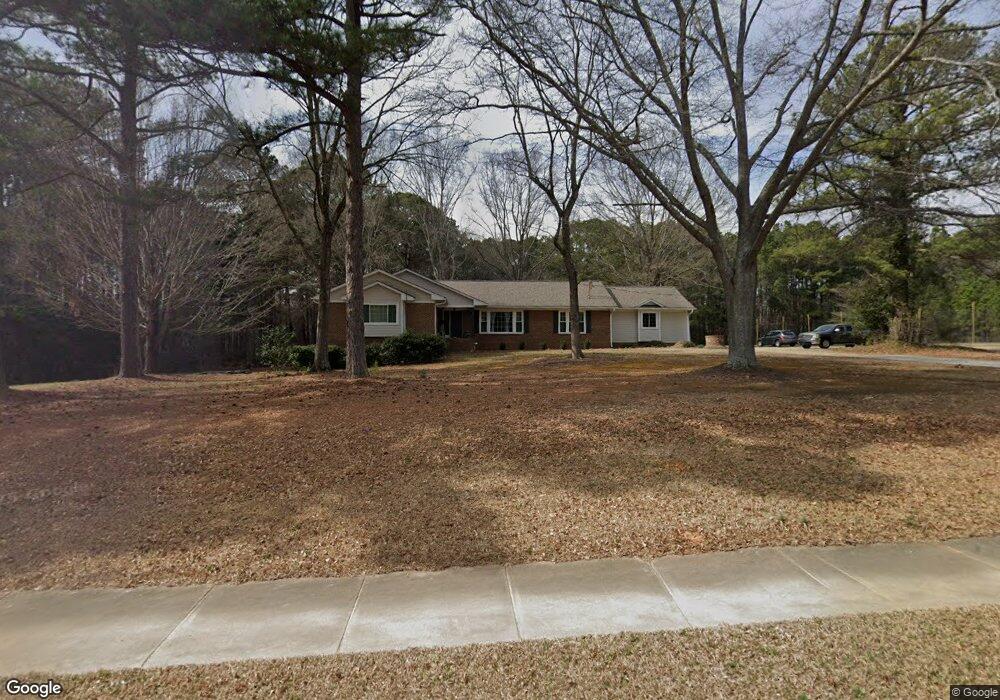
3008 Kildaire Farm Rd Unit A Cary, NC 27518
Middle Creek NeighborhoodEstimated Value: $608,000 - $870,000
--
Bed
2
Baths
2,169
Sq Ft
$331/Sq Ft
Est. Value
About This Home
This home is located at 3008 Kildaire Farm Rd Unit A, Cary, NC 27518 and is currently estimated at $717,715, approximately $330 per square foot. 3008 Kildaire Farm Rd Unit A is a home located in Wake County with nearby schools including Oak Grove Elementary, Lufkin Road Middle School, and TMSA Triangle - Triangle Math and Science Academy.
Ownership History
Date
Name
Owned For
Owner Type
Purchase Details
Closed on
Nov 22, 2016
Sold by
Jones Trilotn Braxton and Jones Sandra Roach
Bought by
Jones Trailton Broxton and Jones Sandra Roach
Current Estimated Value
Home Financials for this Owner
Home Financials are based on the most recent Mortgage that was taken out on this home.
Original Mortgage
$215,000
Outstanding Balance
$172,879
Interest Rate
3.47%
Mortgage Type
New Conventional
Estimated Equity
$544,836
Purchase Details
Closed on
May 5, 2009
Sold by
Jones Braxton Bryant and Bryant Jones B
Bought by
Jones Braxton Bryant and Jones Trilton
Purchase Details
Closed on
Jul 12, 1999
Sold by
Mongatue Harvey L and Montague Texanna J
Bought by
Jones B Bryant and Jones Joyce C
Create a Home Valuation Report for This Property
The Home Valuation Report is an in-depth analysis detailing your home's value as well as a comparison with similar homes in the area
Home Values in the Area
Average Home Value in this Area
Purchase History
| Date | Buyer | Sale Price | Title Company |
|---|---|---|---|
| Jones Trailton Broxton | -- | None Available | |
| Jones Braxton Bryant | -- | None Available | |
| Jones B Bryant | -- | -- |
Source: Public Records
Mortgage History
| Date | Status | Borrower | Loan Amount |
|---|---|---|---|
| Open | Jones Trailton Broxton | $215,000 |
Source: Public Records
Tax History Compared to Growth
Tax History
| Year | Tax Paid | Tax Assessment Tax Assessment Total Assessment is a certain percentage of the fair market value that is determined by local assessors to be the total taxable value of land and additions on the property. | Land | Improvement |
|---|---|---|---|---|
| 2025 | $6,027 | $700,837 | $373,000 | $327,837 |
| 2024 | $5,897 | $700,837 | $373,000 | $327,837 |
| 2023 | $4,462 | $443,319 | $225,490 | $217,829 |
| 2022 | $4,296 | $443,319 | $225,490 | $217,829 |
| 2021 | $4,209 | $443,319 | $225,490 | $217,829 |
| 2020 | $4,232 | $443,319 | $225,490 | $217,829 |
| 2019 | $5,091 | $473,588 | $292,665 | $180,923 |
| 2018 | $4,777 | $473,588 | $292,665 | $180,923 |
| 2017 | $4,590 | $644,788 | $463,865 | $180,923 |
| 2016 | $6,149 | $644,788 | $463,865 | $180,923 |
| 2015 | $4,694 | $688,612 | $485,910 | $202,702 |
| 2014 | $4,426 | $688,612 | $485,910 | $202,702 |
Source: Public Records
Map
Nearby Homes
- 103 Moss Rose Ct
- 203 Crickentree Dr
- 102 Forest Edge Dr
- 10917 Bexhill Dr
- 204 Oxford Mill Ct
- 104 Langston Mill Ct
- 101 Saint Brides Ct
- 114 Kendleton Place
- 313 Mount Eden Place
- 101 Lions Gate Dr
- 201 Piperwood Dr
- 200 Lions Gate Dr
- 107 Sonoma Valley Dr
- 207 Devonbrook Ln
- 612 Hawks Ridge Ct
- 329 Lady Marian Ct
- 401 Felspar Way
- 3117 Ten Rd
- 108 Bittercress Ct
- 103 Glenbrae Ct
- 3028 Kildaire Farm Rd
- 109 Running Creek Rd
- 107 Running Creek Rd
- 111 Running Creek Rd
- 105 Running Creek Rd
- 103 Running Creek Rd
- 101 Running Creek Rd
- 10705 E Bridgford Dr
- 115 Running Creek Rd
- 10709 E Bridgford Dr
- 10701 E Bridgford Dr
- 108 Running Creek Rd
- 10713 E Bridgford Dr
- 106 Running Creek Rd
- 104 Running Creek Rd
- 117 Running Creek Rd
- 102 Running Creek Rd
- 118 Running Creek Rd
- 10717 E Bridgford Dr
- 102 Forest Run Place