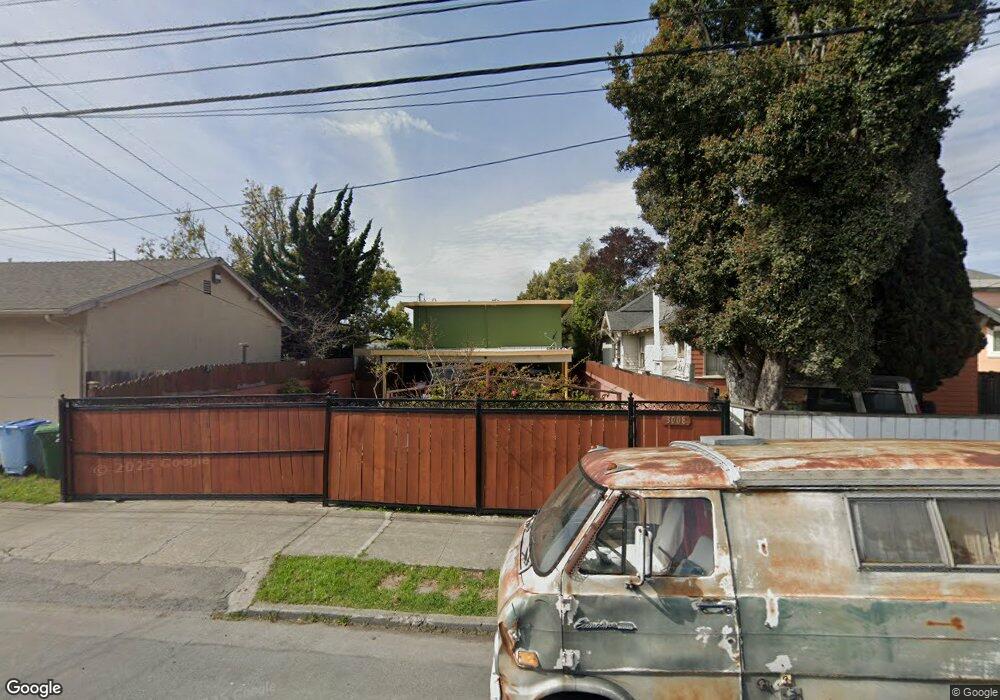
3008 Mabel St Berkeley, CA 94702
West Berkeley NeighborhoodEstimated Value: $1,112,000 - $1,583,000
4
Beds
4
Baths
2,226
Sq Ft
$605/Sq Ft
Est. Value
About This Home
This home is located at 3008 Mabel St, Berkeley, CA 94702 and is currently estimated at $1,347,786, approximately $605 per square foot. 3008 Mabel St is a home located in Alameda County with nearby schools including Malcolm X Elementary School, Oxford Elementary School, and Washington Elementary School.
Ownership History
Date
Name
Owned For
Owner Type
Purchase Details
Closed on
Aug 25, 2020
Sold by
Dehernandez Iliana Blanco
Bought by
Hernandez Fabian
Current Estimated Value
Home Financials for this Owner
Home Financials are based on the most recent Mortgage that was taken out on this home.
Original Mortgage
$640,000
Outstanding Balance
$564,232
Interest Rate
2.9%
Mortgage Type
New Conventional
Estimated Equity
$783,554
Purchase Details
Closed on
Feb 11, 2003
Sold by
Sanchez Lydia M
Bought by
Hernandez Fabian
Home Financials for this Owner
Home Financials are based on the most recent Mortgage that was taken out on this home.
Original Mortgage
$440,000
Interest Rate
8.62%
Mortgage Type
Purchase Money Mortgage
Create a Home Valuation Report for This Property
The Home Valuation Report is an in-depth analysis detailing your home's value as well as a comparison with similar homes in the area
Home Values in the Area
Average Home Value in this Area
Purchase History
| Date | Buyer | Sale Price | Title Company |
|---|---|---|---|
| Hernandez Fabian | -- | None Available | |
| Hernandez Fabian | $550,000 | Placer Title Company |
Source: Public Records
Mortgage History
| Date | Status | Borrower | Loan Amount |
|---|---|---|---|
| Open | Hernandez Fabian | $640,000 | |
| Closed | Hernandez Fabian | $440,000 |
Source: Public Records
Tax History
| Year | Tax Paid | Tax Assessment Tax Assessment Total Assessment is a certain percentage of the fair market value that is determined by local assessors to be the total taxable value of land and additions on the property. | Land | Improvement |
|---|---|---|---|---|
| 2025 | $13,558 | $796,510 | $238,953 | $557,557 |
| 2024 | $13,558 | $780,894 | $234,268 | $546,626 |
| 2023 | $13,264 | $765,588 | $229,676 | $535,912 |
| 2022 | $12,997 | $750,578 | $225,173 | $525,405 |
| 2021 | $13,004 | $735,866 | $220,760 | $515,106 |
| 2020 | $12,242 | $728,325 | $218,497 | $509,828 |
| 2019 | $11,687 | $714,047 | $214,214 | $499,833 |
| 2018 | $11,476 | $700,050 | $210,015 | $490,035 |
| 2017 | $11,057 | $686,327 | $205,898 | $480,429 |
| 2016 | $10,658 | $672,874 | $201,862 | $471,012 |
| 2015 | $10,513 | $662,771 | $198,831 | $463,940 |
| 2014 | $10,688 | $649,791 | $194,937 | $454,854 |
Source: Public Records
Map
Nearby Homes
- 1314 Ashby Ave
- 3032 Mabel St
- 1237 Ashby Ave
- 1080 67th St
- 6628 Helen Ct
- 2751 Wallace St
- 6500 San Pablo Ave
- 1507 Prince St
- 6501 San Pablo Ave Unit 410
- 2747 San Pablo Ave Unit 507
- 6465 San Pablo Ave Unit 203
- 1034 Grayson St
- 1126 Ocean Ave
- 1535 Julia St
- 2790 Sacramento St
- 2782 Sacramento St
- 2774 Sacramento St
- 1164 Ocean Ave
- 2758 Sacramento St
- 3110 California St
- 3004 Mabel St
- 1260 Ashby Ave
- 1255 Carrison St
- 3000 Mabel St
- 1250 Ashby Ave
- 1248 Ashby Ave
- 1253 Carrison St
- 1251 Carrison St
- 1246 Ashby Ave
- 3007 Mabel St
- 3003 Mabel St
- 1301 Carrison St
- 3001 Mabel St
- 1247 Carrison St
- 3011 Mabel St
- 1244 Ashby Ave
- 1303 Carrison St
- 1308 Ashby Ave
- 1241 Carrison St
- 1255 Ashby Ave
Your Personal Tour Guide
Ask me questions while you tour the home.