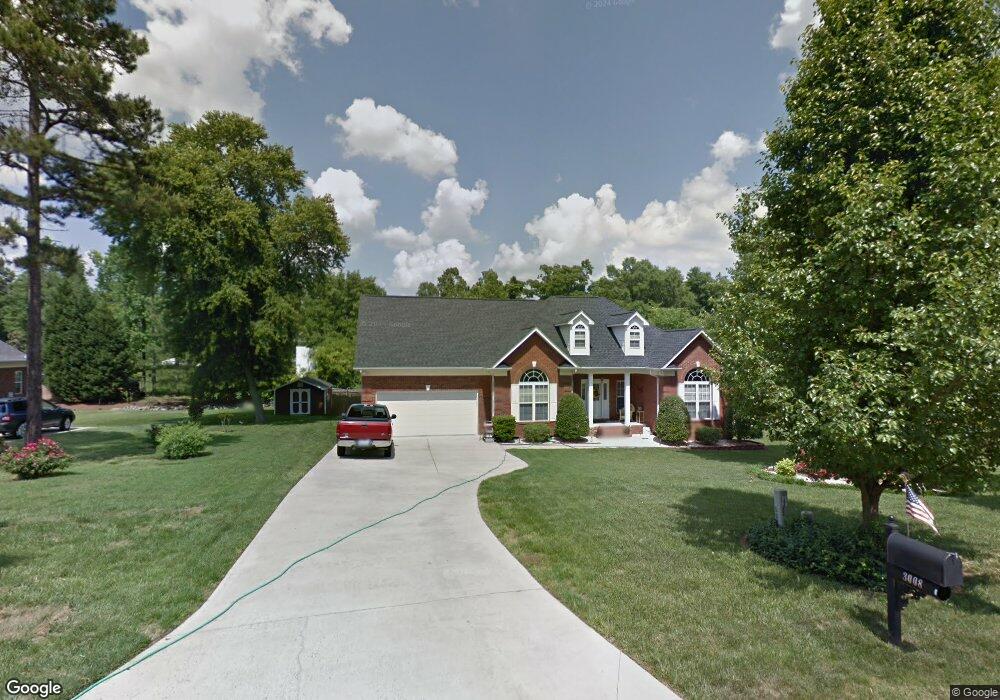
3008 Olde Elizabeth Ln Monroe, NC 28110
Estimated Value: $412,000 - $463,000
--
Bed
2
Baths
2,010
Sq Ft
$220/Sq Ft
Est. Value
About This Home
This home is located at 3008 Olde Elizabeth Ln, Monroe, NC 28110 and is currently estimated at $441,933, approximately $219 per square foot. 3008 Olde Elizabeth Ln is a home located in Union County with nearby schools including Porter Ridge Elementary School, Piedmont Middle School, and Piedmont High School.
Ownership History
Date
Name
Owned For
Owner Type
Purchase Details
Closed on
Aug 18, 2004
Sold by
Hylton Charles C and Hylton Judy L
Bought by
Grondin Ronald L and Grondin Claire R
Current Estimated Value
Purchase Details
Closed on
Jul 22, 2003
Sold by
Fields Charles W and Fields Ann
Bought by
Hylton Charles C and Hylton Judy L
Home Financials for this Owner
Home Financials are based on the most recent Mortgage that was taken out on this home.
Original Mortgage
$187,150
Interest Rate
4%
Mortgage Type
Unknown
Purchase Details
Closed on
Aug 16, 2000
Sold by
Steve Nash John and Steve Sue C
Bought by
Fields Charles W and Fields Ann
Home Financials for this Owner
Home Financials are based on the most recent Mortgage that was taken out on this home.
Original Mortgage
$100,000
Interest Rate
8.17%
Create a Home Valuation Report for This Property
The Home Valuation Report is an in-depth analysis detailing your home's value as well as a comparison with similar homes in the area
Home Values in the Area
Average Home Value in this Area
Purchase History
| Date | Buyer | Sale Price | Title Company |
|---|---|---|---|
| Grondin Ronald L | $207,000 | -- | |
| Hylton Charles C | $198,000 | -- | |
| Fields Charles W | $182,500 | -- |
Source: Public Records
Mortgage History
| Date | Status | Borrower | Loan Amount |
|---|---|---|---|
| Previous Owner | Hylton Charles C | $187,150 | |
| Previous Owner | Fields Charles W | $100,000 |
Source: Public Records
Tax History Compared to Growth
Tax History
| Year | Tax Paid | Tax Assessment Tax Assessment Total Assessment is a certain percentage of the fair market value that is determined by local assessors to be the total taxable value of land and additions on the property. | Land | Improvement |
|---|---|---|---|---|
| 2024 | $2,907 | $266,600 | $49,200 | $217,400 |
| 2023 | $2,870 | $263,200 | $49,200 | $214,000 |
| 2022 | $2,870 | $263,200 | $49,200 | $214,000 |
| 2021 | $2,870 | $263,200 | $49,200 | $214,000 |
| 2020 | $3,148 | $233,700 | $38,500 | $195,200 |
| 2019 | $3,148 | $233,700 | $38,500 | $195,200 |
| 2018 | $1,440 | $233,700 | $38,500 | $195,200 |
| 2017 | $3,195 | $233,700 | $38,500 | $195,200 |
| 2016 | $3,161 | $233,700 | $38,500 | $195,200 |
| 2015 | $1,815 | $233,700 | $38,500 | $195,200 |
| 2014 | $2,661 | $220,910 | $35,000 | $185,910 |
Source: Public Records
Map
Nearby Homes
- 4919 Myers Rd
- 4112 Tricia Ct
- 2712 Thornburg Ct
- 2907 Northwood Dr
- 4416 Poxon Ln
- 4125 Chatterleigh Dr
- 4230 Chatterleigh Dr
- 4304 Mara Ln
- 4313 Chatterleigh Dr
- 4543 Tradd Cir
- 2802 Santiago Cir
- 2822 Hopeton Ct
- 2903 Rosemeade Dr
- 2909 Blueberry Dr
- 4822 Tradd Cir
- 4527 Marshall Ct
- 4720 Tradd Cir
- 2910 Lake James Ct
- 2809 James Hamilton Rd
- 3136 Blueberry Dr
- 3012 Olde Elizabeth Ln
- 3004 Olde Elizabeth Ln
- 3001 Tiffany Dr
- 3007 Olde Elizabeth Ln
- 3000 Olde Elizabeth Ln
- 3000 Tiffany Dr
- 3001 Olde Elizabeth Ln
- 3005 Tiffany Dr
- 2701 Thornburg Ct
- 3016 Olde Elizabeth Ln
- 3011 Olde Elizabeth Ln
- 3011 Olde Elizabeth Ln
- 3017 Olde Elizabeth Ln
- 3011 Olde Elizabeth Ln Unit 39
- 3020 Olde Elizabeth Ln
- 3020 Olde Elizabeth Ln Unit 31
- 2700 Thornburg Ct
- 2705 Thornburg Ct
- 4119 Tricia Ct
- 3009 Tiffany Dr