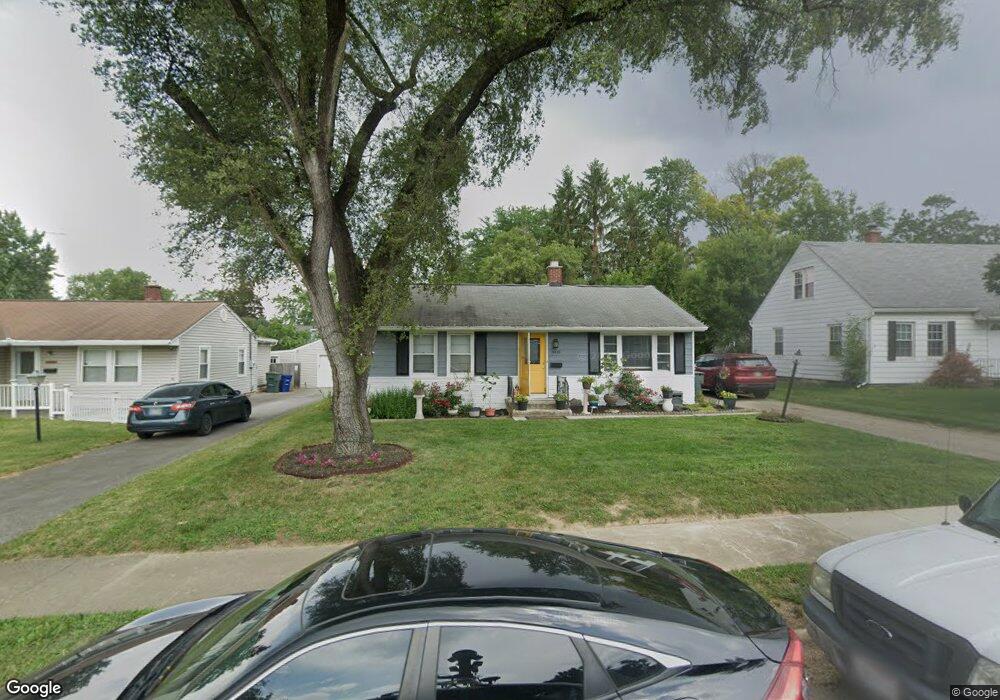
3008 Templeton Rd Columbus, OH 43209
Eastmoor NeighborhoodEstimated Value: $245,000 - $290,000
3
Beds
2
Baths
1,387
Sq Ft
$193/Sq Ft
Est. Value
About This Home
This home is located at 3008 Templeton Rd, Columbus, OH 43209 and is currently estimated at $267,836, approximately $193 per square foot. 3008 Templeton Rd is a home located in Franklin County with nearby schools including Fairmoor Elementary School, Johnson Park Middle School, and Walnut Ridge High School.
Ownership History
Date
Name
Owned For
Owner Type
Purchase Details
Closed on
Aug 3, 2021
Sold by
Adasa Homes Llc
Bought by
Camacho Alicia Mercado
Current Estimated Value
Purchase Details
Closed on
Jul 24, 2020
Sold by
Davis Alison and Estate Of Martha S Weger
Bought by
Adasa Homes Llc
Home Financials for this Owner
Home Financials are based on the most recent Mortgage that was taken out on this home.
Original Mortgage
$79,350
Interest Rate
3%
Mortgage Type
Construction
Purchase Details
Closed on
Feb 15, 2008
Sold by
Estate Of Margaret H Weger
Bought by
Weger Martha S and Weger Doris A
Purchase Details
Closed on
Dec 11, 2007
Sold by
Estate Of Doris A Weger
Bought by
Weger Martha S
Purchase Details
Closed on
Nov 19, 1974
Bought by
Weger Doris A Et Al 3
Create a Home Valuation Report for This Property
The Home Valuation Report is an in-depth analysis detailing your home's value as well as a comparison with similar homes in the area
Home Values in the Area
Average Home Value in this Area
Purchase History
| Date | Buyer | Sale Price | Title Company |
|---|---|---|---|
| Camacho Alicia Mercado | -- | None Listed On Document | |
| Adasa Homes Llc | $80,000 | Crown Search Services | |
| Weger Martha S | -- | None Available | |
| Weger Martha S | -- | None Available | |
| Weger Doris A Et Al 3 | -- | -- |
Source: Public Records
Mortgage History
| Date | Status | Borrower | Loan Amount |
|---|---|---|---|
| Previous Owner | Adasa Homes Llc | $79,350 |
Source: Public Records
Tax History Compared to Growth
Tax History
| Year | Tax Paid | Tax Assessment Tax Assessment Total Assessment is a certain percentage of the fair market value that is determined by local assessors to be the total taxable value of land and additions on the property. | Land | Improvement |
|---|---|---|---|---|
| 2024 | $3,392 | $75,570 | $25,100 | $50,470 |
| 2023 | $3,348 | $75,565 | $25,095 | $50,470 |
| 2022 | $1,930 | $37,210 | $7,700 | $29,510 |
| 2021 | $1,981 | $37,210 | $7,700 | $29,510 |
| 2020 | $1,984 | $37,210 | $7,700 | $29,510 |
| 2019 | $1,882 | $31,020 | $6,410 | $24,610 |
| 2018 | $1,856 | $31,020 | $6,410 | $24,610 |
| 2017 | $1,950 | $31,020 | $6,410 | $24,610 |
| 2016 | $2,020 | $30,490 | $7,420 | $23,070 |
| 2015 | $1,833 | $30,490 | $7,420 | $23,070 |
| 2014 | $1,838 | $30,490 | $7,420 | $23,070 |
| 2013 | $907 | $30,485 | $7,420 | $23,065 |
Source: Public Records
Map
Nearby Homes
- 3012 Hampshire Rd
- 794 S Chesterfield Rd
- 811 S Chesterfield Rd
- 804 S Ashburton Rd
- 723-725 S Chesterfield Rd
- 789 Elizabeth Ave
- 1048 S James Rd
- 633 Eastmoor Blvd
- 2963 Brownlee Ave
- 1077-1079 S James Rd
- 616 Eastmoor Blvd Unit 478
- 618 Eastmoor Blvd
- 2856 Eastminster Rd
- 842 S Hampton Rd
- 843 Kenwick Rd
- 1054 S Hampton Rd
- 789 Chelsea Ave
- 864 S Waverly St
- 565 S Kellner Rd
- 891 S Weyant Ave Unit 893
- 3014 Templeton Rd
- 3000 Templeton Rd
- 3022 Templeton Rd
- 3022 E Templeton
- 2990 Templeton Rd
- 3011 E Mound St
- 3017 E Mound St
- 3005 E Mound St
- 3023 E Mound St
- 3005 Templeton Rd
- 2997 Templeton Rd
- 3011 Templeton Rd
- 3032 Templeton Rd
- 2997 E Mound St
- 2980 Templeton Rd
- 2991 Templeton Rd
- 3029 E Mound St
- 3019 Templeton Rd
- 2981 Templeton Rd
- 2989 E Mound St