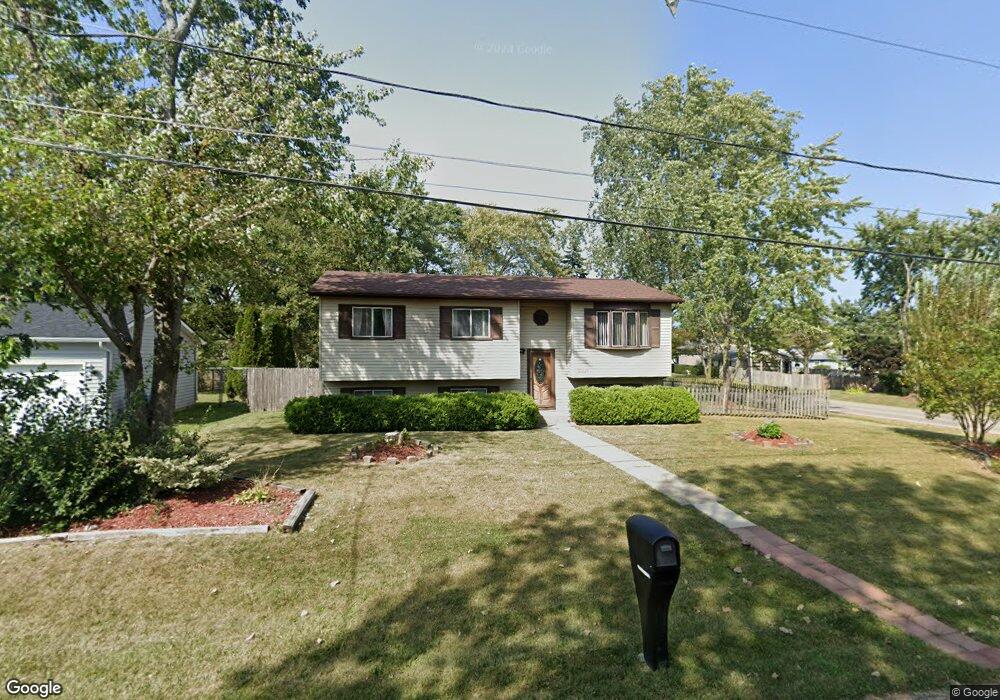
3008 W Nemesis Ave Waukegan, IL 60087
Estimated Value: $265,000 - $285,000
4
Beds
2
Baths
1,000
Sq Ft
$275/Sq Ft
Est. Value
About This Home
This home is located at 3008 W Nemesis Ave, Waukegan, IL 60087 and is currently estimated at $274,713, approximately $274 per square foot. 3008 W Nemesis Ave is a home located in Lake County with nearby schools including Oakdale Elementary School, Jack Benny Middle School, and Waukegan High School.
Ownership History
Date
Name
Owned For
Owner Type
Purchase Details
Closed on
Sep 11, 2007
Sold by
Tyler Myron
Bought by
Tyler Brenda
Current Estimated Value
Home Financials for this Owner
Home Financials are based on the most recent Mortgage that was taken out on this home.
Original Mortgage
$199,838
Outstanding Balance
$126,394
Interest Rate
6.55%
Mortgage Type
FHA
Estimated Equity
$148,319
Purchase Details
Closed on
Dec 22, 2003
Sold by
Tekampe Cynthia M
Bought by
Tyler Brenda and Tyler Myron
Home Financials for this Owner
Home Financials are based on the most recent Mortgage that was taken out on this home.
Original Mortgage
$191,002
Interest Rate
6.08%
Mortgage Type
FHA
Purchase Details
Closed on
Jul 20, 1998
Sold by
Tekampe Thomas R
Bought by
Tekampe Cynthia M
Home Financials for this Owner
Home Financials are based on the most recent Mortgage that was taken out on this home.
Original Mortgage
$104,100
Interest Rate
7.05%
Create a Home Valuation Report for This Property
The Home Valuation Report is an in-depth analysis detailing your home's value as well as a comparison with similar homes in the area
Home Values in the Area
Average Home Value in this Area
Purchase History
| Date | Buyer | Sale Price | Title Company |
|---|---|---|---|
| Tyler Brenda | -- | None Available | |
| Tyler Brenda | $194,000 | Chicago Title Co | |
| Tekampe Cynthia M | -- | First American Title |
Source: Public Records
Mortgage History
| Date | Status | Borrower | Loan Amount |
|---|---|---|---|
| Open | Tyler Brenda | $199,838 | |
| Previous Owner | Tyler Brenda | $191,002 | |
| Previous Owner | Tekampe Cynthia M | $104,100 |
Source: Public Records
Tax History Compared to Growth
Tax History
| Year | Tax Paid | Tax Assessment Tax Assessment Total Assessment is a certain percentage of the fair market value that is determined by local assessors to be the total taxable value of land and additions on the property. | Land | Improvement |
|---|---|---|---|---|
| 2024 | $5,627 | $75,587 | $10,263 | $65,324 |
| 2023 | $5,631 | $67,672 | $9,188 | $58,484 |
| 2022 | $5,631 | $63,597 | $10,508 | $53,089 |
| 2021 | $6,418 | $67,556 | $9,978 | $57,578 |
| 2020 | $6,454 | $62,937 | $9,296 | $53,641 |
| 2019 | $6,443 | $57,671 | $8,518 | $49,153 |
| 2018 | $6,499 | $56,652 | $9,644 | $47,008 |
| 2017 | $6,276 | $50,121 | $8,532 | $41,589 |
| 2016 | $5,803 | $43,553 | $7,414 | $36,139 |
| 2015 | $5,571 | $38,981 | $6,636 | $32,345 |
| 2014 | $3,875 | $28,440 | $5,724 | $22,716 |
| 2012 | $5,022 | $30,812 | $6,202 | $24,610 |
Source: Public Records
Map
Nearby Homes
- 3032 W Vermont Ave
- 36955 N Garrick Ave
- 3320 Sunset Ave
- 2708 Dana Ave
- 2705 Dana Ave
- 36245 N Green Bay Rd
- 2713 Varonen Ave
- 12312 W Audrey Ave
- 12535 W Blanchard Rd
- 2928 W Country Club Ave
- 3000 W Country Club Ave
- 2946 W Country Club Ave
- 12933 W Polo Ave
- 13360 W Blanchard Rd
- 2715 W Greenwood Ave
- 3436 Florida Ave
- 3101 Country Club Ln
- 1913 Chippewa Rd
- 2440 W Cheyenne Rd
- 2350 N Lewis Ave
- 3012 W Nemesis Ave
- 2501 N Northern Ave
- 2480 N Northern Ave
- 3016 W Nemesis Ave
- 2971 Wall Ave
- 2430 N Northern Ave
- 2966 W Nemesis Ave
- 3011 W Nemesis Ave
- 2967 Wall Ave
- 3020 W Nemesis Ave
- 3015 W Nemesis Ave
- 2962 W Nemesis Ave
- 2967 W Nemesis Ave
- 3025 Wall Ave
- 2963 Wall Ave
- 3024 W Nemesis Ave
- 2958 W Nemesis Ave
- 2963 W Nemesis Ave
- 3021 W Nemesis Ave