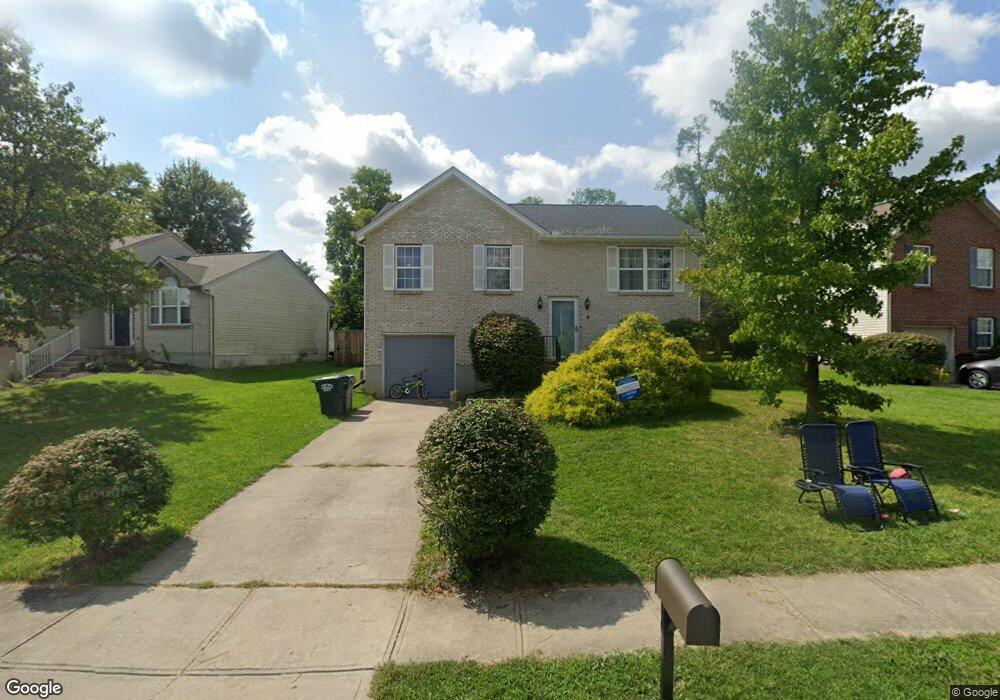
3009 Lansdowne Ln Hebron, KY 41048
Estimated Value: $260,000 - $288,000
3
Beds
3
Baths
1,008
Sq Ft
$276/Sq Ft
Est. Value
About This Home
This home is located at 3009 Lansdowne Ln, Hebron, KY 41048 and is currently estimated at $278,441, approximately $276 per square foot. 3009 Lansdowne Ln is a home located in Boone County with nearby schools including Goodridge Elementary School, Conner Middle School, and Conner High School.
Ownership History
Date
Name
Owned For
Owner Type
Purchase Details
Closed on
Sep 9, 2016
Sold by
Foltz Steven
Bought by
Helmle Jessica L
Current Estimated Value
Home Financials for this Owner
Home Financials are based on the most recent Mortgage that was taken out on this home.
Original Mortgage
$142,373
Outstanding Balance
$113,060
Interest Rate
3.25%
Mortgage Type
FHA
Estimated Equity
$165,381
Purchase Details
Closed on
Apr 29, 2008
Sold by
Foltz Mike and Foltz Brenda S
Bought by
Foltz Steven
Home Financials for this Owner
Home Financials are based on the most recent Mortgage that was taken out on this home.
Original Mortgage
$126,876
Interest Rate
5.86%
Mortgage Type
FHA
Purchase Details
Closed on
Jul 20, 2005
Sold by
Moser Annabell and Moser Walter D
Bought by
Foltz Mike
Home Financials for this Owner
Home Financials are based on the most recent Mortgage that was taken out on this home.
Original Mortgage
$103,600
Interest Rate
5.51%
Mortgage Type
New Conventional
Create a Home Valuation Report for This Property
The Home Valuation Report is an in-depth analysis detailing your home's value as well as a comparison with similar homes in the area
Home Values in the Area
Average Home Value in this Area
Purchase History
| Date | Buyer | Sale Price | Title Company |
|---|---|---|---|
| Helmle Jessica L | $145,000 | None Available | |
| Foltz Steven | $129,500 | American Homeland Title Agen | |
| Foltz Mike | $129,500 | American Homeland Title Ags | |
| Moser Annabell | -- | American Homeland Title Ags |
Source: Public Records
Mortgage History
| Date | Status | Borrower | Loan Amount |
|---|---|---|---|
| Open | Helmle Jessica L | $142,373 | |
| Previous Owner | Foltz Steven | $126,876 | |
| Previous Owner | Foltz Mike | $103,600 |
Source: Public Records
Tax History Compared to Growth
Tax History
| Year | Tax Paid | Tax Assessment Tax Assessment Total Assessment is a certain percentage of the fair market value that is determined by local assessors to be the total taxable value of land and additions on the property. | Land | Improvement |
|---|---|---|---|---|
| 2024 | $2,092 | $194,200 | $35,000 | $159,200 |
| 2023 | $1,607 | $150,500 | $30,000 | $120,500 |
| 2022 | $1,614 | $150,500 | $30,000 | $120,500 |
| 2021 | $1,687 | $150,500 | $30,000 | $120,500 |
| 2020 | $1,642 | $150,500 | $30,000 | $120,500 |
| 2019 | $1,594 | $145,000 | $30,000 | $115,000 |
| 2018 | $1,644 | $145,000 | $30,000 | $115,000 |
| 2017 | $1,581 | $145,000 | $30,000 | $115,000 |
| 2015 | $1,401 | $129,500 | $30,000 | $99,500 |
| 2013 | -- | $129,500 | $30,000 | $99,500 |
Source: Public Records
Map
Nearby Homes
- 1852 Princess Ct
- 2721 Berwood Ln
- 2768 Berwood Ln
- 2772 Berwood Ln
- 1672 Jeffrey Ln
- 3061 Merrie Dr
- 791 N Bend Rd Unit 6
- 2639 Bethlehem Ln
- 2731 Presidential Dr
- The McPherson Plan at Sawgrass - Designer Collection
- Winston Plan at Sawgrass - Designer Collection
- Carrington Plan at Sawgrass - Designer Collection
- Emmett Plan at Sawgrass - Designer Collection
- Blair Plan at Sawgrass - Designer Collection
- Jensen Plan at Sawgrass - Maple Street Collection
- Greenbriar Plan at Sawgrass - Maple Street Collection
- Avery Plan at Sawgrass - Designer Collection
- Calvin Plan at Sawgrass - Designer Collection
- Wyatt Plan at Sawgrass - Designer Collection
- Breckenridge Plan at Sawgrass - Maple Street Collection
- 3013 Lansdowne Ln
- 3005 Lansdowne Ln
- 3017 Lansdowne Ln
- 3001 Lansdowne Ln
- 3021 Lansdowne Ln
- 3008 Lansdowne Ln
- 3004 Lansdowne Ln
- 1881 Asbury Way
- 3012 Lansdowne Ln
- 3016 Lansdowne Ln
- 3025 Lansdowne Ln
- 3020 Lansdowne Ln
- 1877 Asbury Way
- 3024 Lansdowne Ln
- 3029 Lansdowne Ln
- 411 Lansdowne Ln
- 1888 Asbury Way
- 1884 Asbury Way
- 1892 Asbury Way
- 1763 Shari Ct