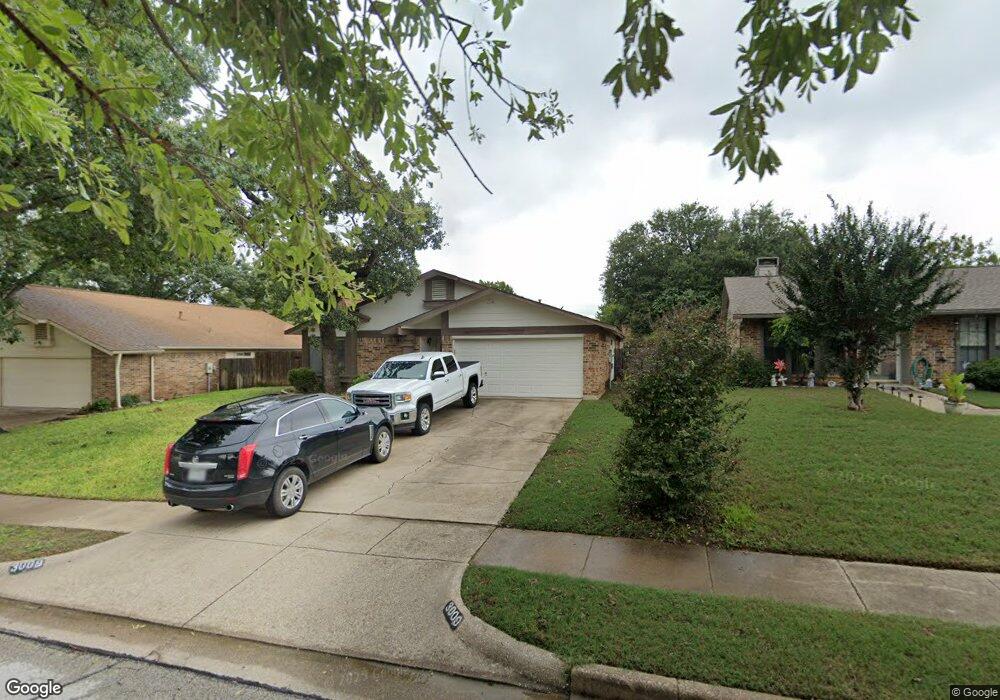
3009 Oakridge Dr Bedford, TX 76021
Estimated Value: $351,581 - $390,000
3
Beds
2
Baths
1,622
Sq Ft
$229/Sq Ft
Est. Value
About This Home
This home is located at 3009 Oakridge Dr, Bedford, TX 76021 and is currently estimated at $371,645, approximately $229 per square foot. 3009 Oakridge Dr is a home located in Tarrant County with nearby schools including Spring Garden Elementary School, Harwood Junior High School, and Trinity High School.
Ownership History
Date
Name
Owned For
Owner Type
Purchase Details
Closed on
Jun 17, 2020
Sold by
Turner Kevin S and Turner Mandy K
Bought by
Teames Christopher and Teames Kayla M
Current Estimated Value
Home Financials for this Owner
Home Financials are based on the most recent Mortgage that was taken out on this home.
Original Mortgage
$183,750
Outstanding Balance
$129,175
Interest Rate
3.2%
Mortgage Type
New Conventional
Estimated Equity
$242,470
Purchase Details
Closed on
Oct 11, 1996
Sold by
Silknitter Steven Roger and Silknitter Danielle Janine
Bought by
Castle Bart W and Castle Kellie A
Home Financials for this Owner
Home Financials are based on the most recent Mortgage that was taken out on this home.
Original Mortgage
$91,820
Interest Rate
8.33%
Mortgage Type
FHA
Purchase Details
Closed on
May 3, 1994
Sold by
Scales Ralph D and Scales Trudy
Bought by
Silknitter Steven Roger and Silknitter Danielle Janine
Home Financials for this Owner
Home Financials are based on the most recent Mortgage that was taken out on this home.
Original Mortgage
$83,947
Interest Rate
8.03%
Mortgage Type
FHA
Create a Home Valuation Report for This Property
The Home Valuation Report is an in-depth analysis detailing your home's value as well as a comparison with similar homes in the area
Home Values in the Area
Average Home Value in this Area
Purchase History
| Date | Buyer | Sale Price | Title Company |
|---|---|---|---|
| Teames Christopher | -- | Juniper Title | |
| Castle Bart W | -- | Ticor Land Title Co | |
| Silknitter Steven Roger | -- | Fidelity National Title Agen |
Source: Public Records
Mortgage History
| Date | Status | Borrower | Loan Amount |
|---|---|---|---|
| Open | Teames Christopher | $183,750 | |
| Previous Owner | Castle Bart W | $91,820 | |
| Previous Owner | Silknitter Steven Roger | $83,947 |
Source: Public Records
Tax History Compared to Growth
Tax History
| Year | Tax Paid | Tax Assessment Tax Assessment Total Assessment is a certain percentage of the fair market value that is determined by local assessors to be the total taxable value of land and additions on the property. | Land | Improvement |
|---|---|---|---|---|
| 2025 | $4,981 | $330,565 | $75,000 | $255,565 |
| 2024 | $4,981 | $330,565 | $75,000 | $255,565 |
| 2023 | $5,589 | $324,373 | $45,000 | $279,373 |
| 2022 | $5,786 | $269,570 | $45,000 | $224,570 |
| 2021 | $5,673 | $240,842 | $45,000 | $195,842 |
| 2020 | $5,192 | $222,368 | $45,000 | $177,368 |
| 2019 | $4,823 | $223,798 | $45,000 | $178,798 |
| 2018 | $4,003 | $180,484 | $45,000 | $135,484 |
| 2017 | $3,969 | $185,440 | $18,000 | $167,440 |
| 2016 | $3,608 | $178,156 | $18,000 | $160,156 |
| 2015 | $3,130 | $135,600 | $18,000 | $117,600 |
| 2014 | $3,130 | $135,600 | $18,000 | $117,600 |
Source: Public Records
Map
Nearby Homes
- 2909 Oakridge Dr
- 2220 Tiffany Glenn Ct
- 2922 Beachtree Ln
- 3152 Woodbridge Dr
- 2600 Willow Bend
- 3024 Highgate Ln
- 2521 Sanders Ct
- 2616 Greenwood Ct
- 2709 Willow Bend
- 2516 Classic Ct W
- 3532 Meadowside Dr
- 2601 Murphy Dr
- 3513 Meadowside Dr
- 2417 Meadow Ct
- 2209 Laurel Ct
- 2609 Woodson Dr
- 22 Lincolnshire Cir
- 2109 Oakmeadow St
- 2501 Murphy Dr
- 2700 Mimosa Ct
- 3005 Oakridge Dr
- 3013 Oakridge Dr
- 2245 Homecraft Ln
- 2249 Homecraft Ln
- 2241 Homecraft Ln
- 3017 Oakridge Dr
- 2317 Hollybush Ln
- 2313 Hollybush Ln
- 2312 Sequoia Ln
- 3004 Oakridge Dr
- 3008 Oakridge Dr
- 3000 Oakridge Dr
- 3012 Oakridge Dr
- 2308 Sequoia Ln
- 2237 Homecraft Ln
- 2936 Oakridge Dr
- 2304 Sequoia Ln
- 3016 Oakridge Dr
- 2317 Sequoia Ln
- 2933 Woodbridge Dr