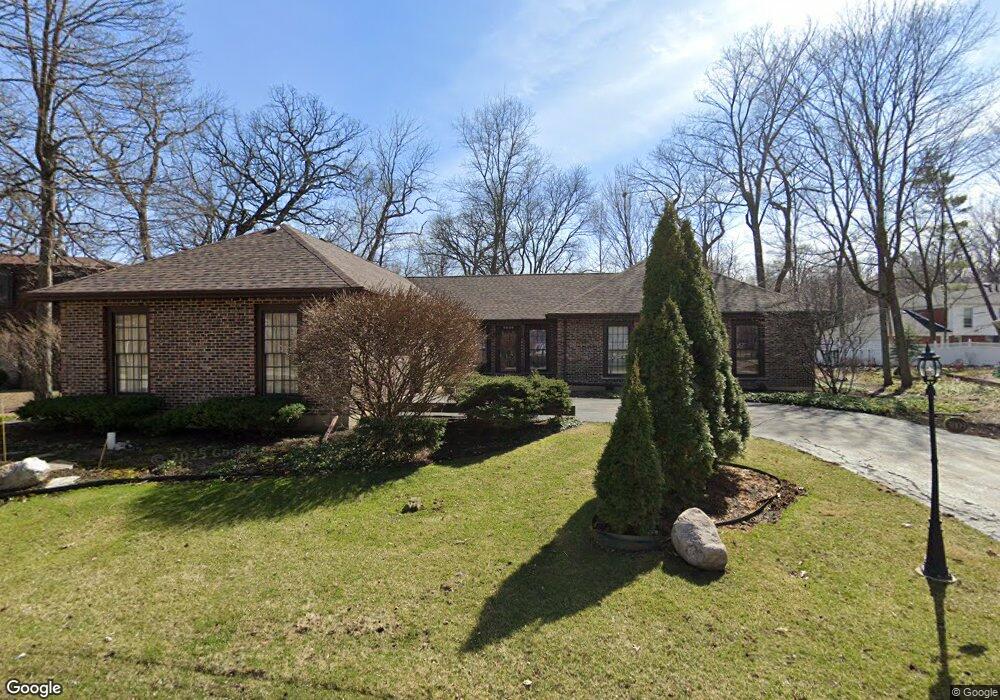
3009 Oaksbury Ct Rolling Meadows, IL 60008
Creekside NeighborhoodEstimated Value: $649,696 - $762,000
5
Beds
3
Baths
2,798
Sq Ft
$248/Sq Ft
Est. Value
About This Home
This home is located at 3009 Oaksbury Ct, Rolling Meadows, IL 60008 and is currently estimated at $693,924, approximately $248 per square foot. 3009 Oaksbury Ct is a home located in Cook County with nearby schools including Willow Bend Elementary School, Galatia Junior High School, and William Fremd High School.
Ownership History
Date
Name
Owned For
Owner Type
Purchase Details
Closed on
Nov 5, 1999
Sold by
Schick Frederick I
Bought by
Lepenske Zieske Randolph and Lepenske Zieske Patricia A
Current Estimated Value
Home Financials for this Owner
Home Financials are based on the most recent Mortgage that was taken out on this home.
Original Mortgage
$240,000
Outstanding Balance
$73,102
Interest Rate
7.72%
Estimated Equity
$620,822
Purchase Details
Closed on
May 27, 1999
Sold by
Schick Fredrick I and Schick Susan E
Bought by
Schick Fredrick I and Schick Susan E
Home Financials for this Owner
Home Financials are based on the most recent Mortgage that was taken out on this home.
Original Mortgage
$280,000
Interest Rate
6.75%
Create a Home Valuation Report for This Property
The Home Valuation Report is an in-depth analysis detailing your home's value as well as a comparison with similar homes in the area
Home Values in the Area
Average Home Value in this Area
Purchase History
| Date | Buyer | Sale Price | Title Company |
|---|---|---|---|
| Lepenske Zieske Randolph | $347,500 | -- | |
| Schick Fredrick I | -- | -- | |
| Schick Fredrick I | $350,000 | -- |
Source: Public Records
Mortgage History
| Date | Status | Borrower | Loan Amount |
|---|---|---|---|
| Open | Lepenske Zieske Randolph | $240,000 | |
| Previous Owner | Schick Fredrick I | $280,000 |
Source: Public Records
Tax History Compared to Growth
Tax History
| Year | Tax Paid | Tax Assessment Tax Assessment Total Assessment is a certain percentage of the fair market value that is determined by local assessors to be the total taxable value of land and additions on the property. | Land | Improvement |
|---|---|---|---|---|
| 2024 | $10,723 | $37,804 | $7,194 | $30,610 |
| 2023 | $10,267 | $39,931 | $7,194 | $32,737 |
| 2022 | $10,267 | $39,931 | $7,194 | $32,737 |
| 2021 | $10,487 | $36,671 | $4,578 | $32,093 |
| 2020 | $10,458 | $36,671 | $4,578 | $32,093 |
| 2019 | $10,915 | $42,267 | $4,578 | $37,689 |
| 2018 | $9,794 | $35,436 | $4,251 | $31,185 |
| 2017 | $11,775 | $39,282 | $4,251 | $35,031 |
| 2016 | $12,819 | $41,996 | $4,251 | $37,745 |
| 2015 | $10,768 | $37,500 | $3,924 | $33,576 |
| 2014 | $10,566 | $37,500 | $3,924 | $33,576 |
| 2013 | $10,273 | $37,500 | $3,924 | $33,576 |
Source: Public Records
Map
Nearby Homes
- 200 Edgewood Ln
- 208 Brookdale Ln
- 2600 Brookwood Way Dr Unit 316
- 2600 Brookwood Way Dr Unit 305
- 2600 Brookwood Unit 314
- 2600 Brookwood Way Dr Unit 212
- 160 E Forest Ln
- 3805 Fairfax Ave
- 3400 Wellington Ct Unit 306
- 3355 Kirchoff Rd Unit 6A
- 2401 Rohlwing Rd
- 3265 Kirchoff Rd Unit 223
- 2041 Vermont St
- 3600 Owl Dr
- 2 Croydon on Duxbury
- 4301 Euclid Ave
- 4 Eton on Oxford
- 4941 Emerson Ave
- 372 Longacres Ln
- 4512 Kings Walk Dr Unit 1D
- 3 Applejack Rd
- 3008 Oaksbury Ct
- 3001 Oaksbury Ct
- 2 Applejack Rd
- 3000 Oaksbury Ct
- 2931 Oaksbury Ct
- 1 Applejack Rd
- 5 Stoneridge Rd
- 2916 Oaksbury Ct
- 2932 Oaksbury Ct
- 2923 Oaksbury Ct
- 3 Stoneridge Rd
- 2924 Oaksbury Ct
- 4416 Dawngate Ct
- 4410 Dawngate Ct
- 4 Rumford on Asbury
- 10 Rumford on Asbury
- 7 Bridgton on Asbury
- 1 Stoneridge Rd
- 12 Rumford on Asbury