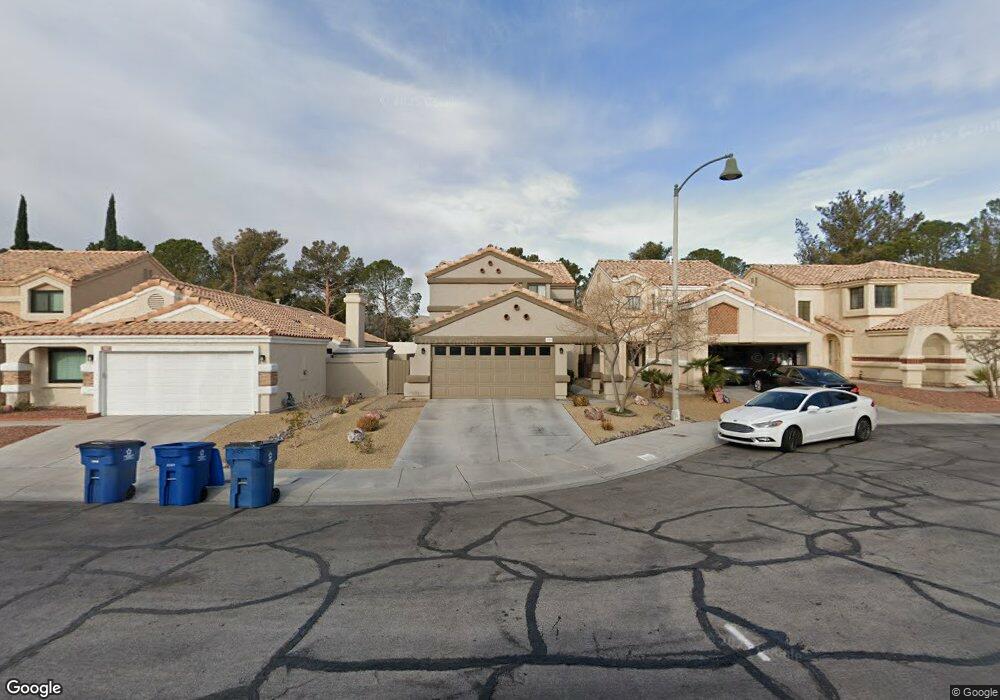
3009 Sandbar Ct Unit 4 Las Vegas, NV 89117
The Section Seven NeighborhoodEstimated Value: $465,652 - $496,000
3
Beds
2
Baths
1,677
Sq Ft
$284/Sq Ft
Est. Value
About This Home
This home is located at 3009 Sandbar Ct Unit 4, Las Vegas, NV 89117 and is currently estimated at $475,663, approximately $283 per square foot. 3009 Sandbar Ct Unit 4 is a home located in Clark County with nearby schools including M J Christensen Elementary School, Clifford J Lawrence Junior High School, and Bonanza High School.
Ownership History
Date
Name
Owned For
Owner Type
Purchase Details
Closed on
May 9, 2008
Sold by
Bergeron Julie
Bought by
Bergeron Kenneth P
Current Estimated Value
Home Financials for this Owner
Home Financials are based on the most recent Mortgage that was taken out on this home.
Original Mortgage
$271,005
Outstanding Balance
$171,626
Interest Rate
5.88%
Mortgage Type
New Conventional
Estimated Equity
$304,037
Purchase Details
Closed on
Apr 15, 2004
Sold by
Bergeron Julie M
Bought by
Bergeron Kenneth P
Home Financials for this Owner
Home Financials are based on the most recent Mortgage that was taken out on this home.
Original Mortgage
$235,000
Interest Rate
1%
Mortgage Type
Negative Amortization
Purchase Details
Closed on
Jul 25, 2001
Sold by
Rydell Cynthia A
Bought by
Bergeron Kenneth P and Bergeron Julie M
Home Financials for this Owner
Home Financials are based on the most recent Mortgage that was taken out on this home.
Original Mortgage
$159,018
Interest Rate
7.21%
Mortgage Type
VA
Create a Home Valuation Report for This Property
The Home Valuation Report is an in-depth analysis detailing your home's value as well as a comparison with similar homes in the area
Home Values in the Area
Average Home Value in this Area
Purchase History
| Date | Buyer | Sale Price | Title Company |
|---|---|---|---|
| Bergeron Kenneth P | -- | First American Title Howard | |
| Bergeron Kenneth P | -- | Ticor Title Of Nevada Inc | |
| Bergeron Kenneth P | $155,900 | Lawyers Title |
Source: Public Records
Mortgage History
| Date | Status | Borrower | Loan Amount |
|---|---|---|---|
| Open | Bergeron Kenneth P | $271,005 | |
| Closed | Bergeron Kenneth P | $235,000 | |
| Closed | Bergeron Kenneth P | $159,018 |
Source: Public Records
Tax History Compared to Growth
Tax History
| Year | Tax Paid | Tax Assessment Tax Assessment Total Assessment is a certain percentage of the fair market value that is determined by local assessors to be the total taxable value of land and additions on the property. | Land | Improvement |
|---|---|---|---|---|
| 2025 | $2,403 | $89,619 | $42,000 | $47,619 |
| 2024 | $2,225 | $89,619 | $42,000 | $47,619 |
| 2023 | $2,225 | $81,866 | $36,050 | $45,816 |
| 2022 | $2,061 | $70,546 | $28,350 | $42,196 |
| 2021 | $1,908 | $68,837 | $28,350 | $40,487 |
| 2020 | $1,769 | $65,962 | $25,550 | $40,412 |
| 2019 | $1,658 | $61,794 | $21,700 | $40,094 |
| 2018 | $1,582 | $60,027 | $21,350 | $38,677 |
| 2017 | $1,981 | $60,414 | $21,000 | $39,414 |
| 2016 | $1,482 | $53,837 | $14,000 | $39,837 |
| 2015 | $1,478 | $43,726 | $10,150 | $33,576 |
| 2014 | $1,435 | $44,087 | $7,700 | $36,387 |
Source: Public Records
Map
Nearby Homes
- 9713 Cascade Falls Ave
- 9724 Cascade Falls Ave
- 3001 Bridge Creek St
- 9605 Blowing Sand Cir
- 9624 Beach Water Cir
- 9708 Blazing Star Ct
- 9717 Sierra Mesa Ave
- 9548 Wooden Pier Way
- 9504 Cliff View Way
- 9429 Abalone Way
- 9544 Lazy River Dr
- 2728 Monrovia Dr
- 2724 Monrovia Dr
- 9612 Chianti Ln
- 3009 Periscope Ct
- 3213 Shallow Point Cir
- 2821 Willow Wind Ct
- 2701 Purtell Cir
- 2909 Ivory Reef Ct
- 2913 Domino Way
- 3013 Sandbar Ct
- 3005 Sandbar Ct Unit n/a
- 3005 Sandbar Ct
- 3017 Sandbar Ct
- 3001 Sandbar Ct Unit n/a
- 3001 Sandbar Ct
- 3021 Sandbar Ct
- 3012 Sandbar Ct
- 3025 Sandbar Ct
- 3016 Sandbar Ct
- 3008 Sandbar Ct
- 3004 Sandbar Ct Unit 4
- 3012 Hampton Bluff St
- 3000 Sandbar Ct
- 3020 Sandbar Ct
- 3008 Hampton Bluff St
- 3024 Sandbar Ct Unit 4
- 9701 Terrace Green Ave
- 9629 Intercoastal Dr
- 9605 Bottle Creek Ln